Solve each inequality and graph its solution. X 1 > 7 3 -5 -4 -4 -3 -2
Question:
Solve each inequality and graph its solution.
Transcribed Image Text:
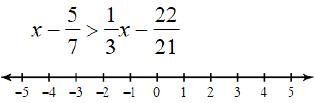
X 1 > 7 3 -5 -4 -4 -3 -2 - 1 22 21 0 12 3 ++ 4 5
Fantastic news! We've Found the answer you've been seeking!
Step by Step Answer:
Answer rating: 100% (QA)
1 2...View the full answer
Answered By
Ashish Jaiswal
I have completed B.Sc in mathematics and Master in Computer Science.
4.90+
20+ Reviews
39+ Question Solved
Related Book For
Intro To College Math Basic Arithmetic Geometry Algebra Probability And Stats
ISBN: 9781097384310
1st Edition
Authors: Nathan Frey
Question Posted:
Students also viewed these Mathematics questions
-
You are the chief analyst that is responsible for monitoring sales at your company. The CEO has tasked you with providing the board of directors with some high-level insights regarding the sales...
-
In Exercises 6974, solve each inequality and graph the solution set on a real number line. 2x 2 + 5x - 3 < 0
-
In Exercises 6974, solve each inequality and graph the solution set on a real number line. 2x 2 + 9x + 4 0
-
Consider the following hypotheses: H 0 : = 140 H 1 : 140 Given that x = 148.1, s = 37.5, n = 20, and = 0.02, answer the following questions: a. What conclusion should be drawn? b. Use PHStat to...
-
Paris Company and Troyer Company are competing businesses. Both began operations 6 years ago and are quite similar in most respects. The current balance sheet data for the two companies are shown...
-
The financial statements of The Hershey Company appear in Appendix B, following the financial statements for Tootsie Roll in Appendix A. Assume Hersheys average number of shares outstanding was...
-
Which of the following is true regarding the direct write-off method of accounting for uncollectibles? a. The direct write-off method does not adhere to GAAP. b. The direct write-off method does not...
-
Multiple Choice Questions 1. Moore Company carries product A in inventory on December 31, 2007 at its unit cost of $7.50. Because of a sharp decline in demand for the product, the selling price was...
-
What is the maximum price you will pay for a bond with a face value of $1,000 and a coupon rate of 14%, paid annually, if you want a yield to maturity of 10%? Assume that the bond will mature in 10...
-
Solve each equation. 10 7 P 3 5 - 22 5
-
Solve each equation. -6(6b-8)= -3b + 3(2b + 3)
-
Calculate the composition of the gaseous mixture obtained when 1.25 mol of carbon dioxide is exposed to hot carbon at 800oC in a 1.25-L vessel. The equilibrium constant Kc at 800oC is 14.0 for the...
-
Explain your understanding of the benefits for each of the corporations involved.
-
Assume you are a systems designer and your organization is building a new inventory management system. In reviewing the requirements documentation, it appears that an error was made and some...
-
In an information system, the process building blocks represent the work that occurs in a system, which may be performed by people or by computers and machinery. Stakeholders tend to have different...
-
(a) Verify that the transitions in the state- machine diagram in Figure 4-27 obey the two transition conditions for state diagrams. (b) Repeat part (a) for the state-machine diagram in Figure 4-28....
-
System designers and system builders also tend to have very different views of system building blocks. Explain the different ways that designers and builders might view the communication building...
-
Sport-time produces high-quality basketballs. If the fixed cost per basketball is $3 when the company produces 12,000 basketballs, what is the fixed cost per basketball when it produces 15,000...
-
A crop-dusting plane flies over a level field at a height of 25 ft. If the dust leaves the plane through a 30 angle and hits the ground after the plane travels 75 ft, how wide a strip is dusted? See...
-
Refer to Exercise 21.7. Determine the ARL until the x chart signals that the process is out of control when it is under control. In exercise 21.7 The control limits of an x chart are set at two...
-
The control limits of an x chart are set at two standard errors from the centerline. Calculate the probability that on any sample the control chart will indicate that the process is out of control...
-
Refer to Exercise 21.5. What is the average run length until the x chart signals that the process is out of control when it is under control? In exercise 21.5 If the control limits of an x chart are...
-
Marketing Performance Systems : I have learned through the years that measuring marketing performance is critical to the existence of any business...A marketing performance system will allow the...
-
What sections does a marketing plan include? How can companies monitor and improve marketing activities and performance (called marketing metrics)? Please provide appropriate references to your...
-
Identify at least five metrics to measure your company's marketing performance Describe what aspects of your marketing strategy (customer satisfaction, product performance, and so on) each metric...
Study smarter with the SolutionInn App