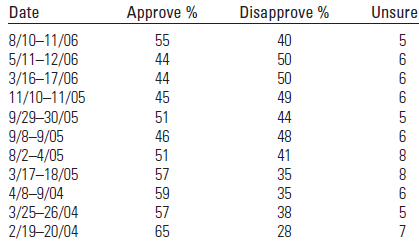
Many opinion polls have tracked opinions regarding the fear of terrorist attacks following the September 11, 2001,
Question:

a. Draw a line chart to describe the percentage that approve of Bush€™s handling of terrorism and homeland security. Use time as the horizontal axis.
b. Superimpose another line chart on the one drawn in part a to describe the percentage that do not approve.
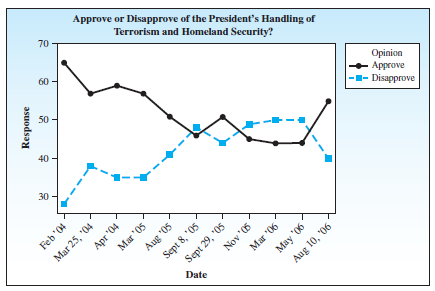
c. The following line chart was created using MINITAB. Does it differ from the graph that you drew? Use the line chart to summarize changes in the polls just after the terrorist attacks in Spain on March 11, 2004 and in England in July of 2005.
d. A plot to bring down domestic flights from England to the United States was foiled by British undercover agents, and the arrest of 12 suspects followed on August 9, 2006. Summarize any changes in approval rating that may have been brought about following the August 9th arrests.

Step by Step Answer:

Introduction To Probability And Statistics
ISBN: 9780495389538
13th Edition
Authors: William Mendenhall, Robert J. Beaver, Barbara M. Beaver


