

Question: Reconsider the data in the dotplot in the previous question about the number of states that students had visited. Suppose the observation recorded as 43
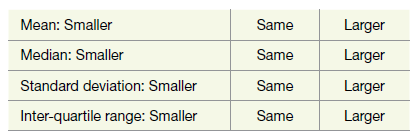
Reconsider the data in the dotplot in the previous question about the number of states that students had visited. Suppose the observation recorded as 43 states is a typo and was meant to be 34. If we corrected this entry in the data set, how would the following numerical statistics change, if at all?
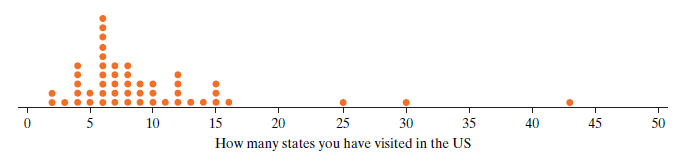
Data from previous exercise
An instructor collected data on the number of states that 50 students in her class had visited in the U.S. The results are shown in the 6.1.11 dotplot.
Mean: Smaller Same Larger Median: Smaller Standard deviation: Smaller Inter-quartile range: Smaller Same Larger Same Larger Same Larger 20 How many states you have visited in the US 5 10 15 25 35 40 45 30 50
Step by Step Solution
3.38 Rating (160 Votes )
There are 3 Steps involved in it
Mean sma... View full answer

Get step-by-step solutions from verified subject matter experts