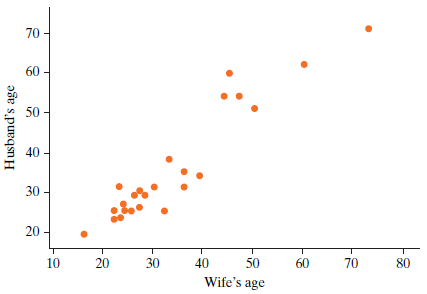
To investigate whether or not people tend to marry spouses of similar ages or whether husbands tend
Question:
a. Here€™s a scatterplot of the ages of the husbands and their wives (one dot for each husband-wife pair). What does the scatterplot reveal?

b. Explain why it is reasonable to say that the marriage age of the husband and the marriage age of the wife should not be treated as independent observations.
Because the data are paired, instead of comparing ages of husbands and wives, we should instead look at the difference in age between husbands and wives.
c. Define the appropriate parameter of interest in the context of the study.
d. State the appropriate null and alternative hypotheses in the context of the study.
e. Use the Matched Pairs applet to produce appropriate graphical displays (dotplot) and summary statistics (sample size, mean, and SD) for the data. Comment on whether this descriptive analysis of the data suggests whether or not husbands tend to be older than their wives.
f. Use the Matched Pairs applet to find an approximate p-value.
g. Interpret the p-value in the context of the study. That is, what is the p-value a probability of?
h. Give a conclusion about the strength of evidence based on the p-value.
Step by Step Answer:

Introduction To Statistical Investigations
ISBN: 9781118172148
1st Edition
Authors: Beth L.Chance, George W.Cobb, Allan J.Rossman Nathan Tintle, Todd Swanson Soma Roy


