

Question: Use the control chart limits developed in Exercise 20.40 and the following sample results to evaluate whether the process is in control: Sample 4 3
Use the control chart limits developed in Exercise 20.40 and the following sample results to evaluate whether the process is in control: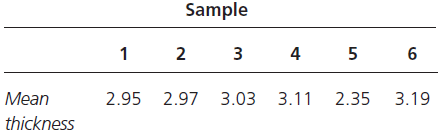
Sample 4 3 1 2 4 5 6 2.95 2.97 3.03 3.11 2.35 3.19 Mean thickness
Step by Step Solution
★★★★★
3.44 Rating (179 Votes )
There are 3 Steps involved in it
1 Expert Approved Answer
Step: 1 Unlock

Using the center line and control limits dev... View full answer
Question Has Been Solved by an Expert!
Get step-by-step solutions from verified subject matter experts
Step: 2 Unlock
Step: 3 Unlock
Document Format (2 attachments)
1606_606321ef344c2_669017.pdf
180 KBs PDF File
1606_606321ef344c2_669017.docx
120 KBs Word File