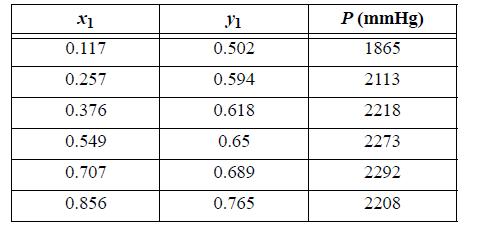
Fit the data from problem 11.25 to the following model by regression over all points, and compare
Question:
Fit the data from problem 11.25 to the following model by regression over all points, and compare with the experimental data on the same plot, using
(a) – (d) as in problem 12.8.
(e) Plot the T-x-y diagram at 1 bar, based on the fits specified by your instructor.
Data from problem 12.8
Fit the data from problem 11.11 to the following model by regression over all points, and compare with the experimental data on the same plot, using
(a) The Scatchard-Hildebrand model with k12 = 0
(b) The SSCED model with a default value of k12
(c) The SSCED model with k12 matched to the data
(d) The van Laar equation
(e) Plot the P-x-y diagram at 80°C, based on the fits specified by your instructor.
Data from problem 11.25
Fit the specified model to the methanol(1) + benzene(2) system P-x-y data at 90°C by minimizing the sum of squares of the pressure residual. Plot the resultant fit together with the original data for both phases (data are in problem 11.10), using

Step by Step Answer:

Introductory Chemical Engineering Thermodynamics
ISBN: 9780136068549
2nd Edition
Authors: J. Elliott, Carl Lira


