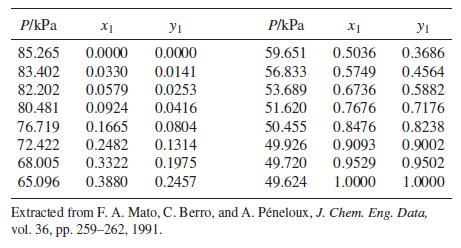
Following are VLE data for the system acetonitrile(1)/benzene(2) at 45C: The data are well correlated by the
Question:
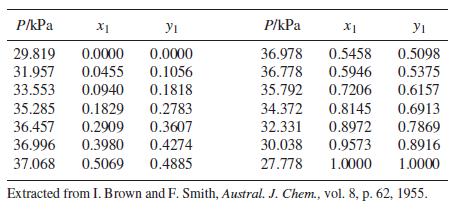
Following are VLE data for the system acetonitrile(1)/benzene(2) at 45°C:

The data are well correlated by the three-parameter Margules equation (see Prob. 13.37).
(a) Basing calculations on Eq. (13.24), find the values of parameters A12, A21, and C that provide the best fit of GE∕RT to the data.
(b) Prepare a plot of ln γ1, ln γ2, and GE∕x1x2 RT vs. x1 showing both the correlation and experimental values.
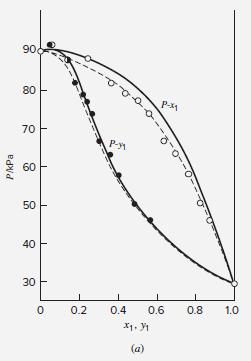
(c) Prepare a Pxy diagram [see Fig. 13.8(a)] that compares the experimental data with the correlation determined in (a).
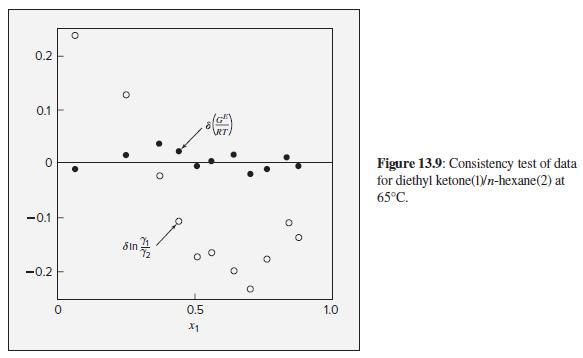
(d) Prepare a consistency-test diagram like Fig. 13.9.
(e) Using Barker’s method, find the values of parameters A12, A21, and C that provide the best fit of the P–x1 data. Prepare a diagram showing the residuals δP and δy1 plotted vs. x1.
Prob. 13.37
VLE data for methyl tert-butyl ether(1)/dichloromethane(2) at 308.15 K are as follows:

The data are well correlated by the three-parameter Margules equation [an extension of Eq. (13.39)]: Implied by this equation are the expressions:
 (a) Basing calculations on Eq. (13.24), find the values of parameters A12, A21, and C that provide the best fit of GE∕RT to the data.
(b) Prepare a plot of ln γ1, ln γ2, and GE∕(x1x2RT ) vs. x1 showing both the correlation and experimental values.
(c) Prepare a Pxy diagram [see Fig. 13.8(a)] that compares the experimental data with the correlation determined in (a).
(d) Prepare a consistency-test diagram like Fig. 13.9.
(e) Using Barker’s method, find the values of parameters A12, A21, and C that provide the best fit of the P–x1 data. Prepare a diagram showing the residuals δP and δy1 plotted vs. x1.
Eq. (13.39)
![]()
(a) Eq. (13.24)

Fig. 13.8 (a)

Fig. 13.9

Step by Step Answer:

Introduction To Chemical Engineering Thermodynamics
ISBN: 9781259696527
8th Edition
Authors: J.M. Smith, Hendrick Van Ness, Michael Abbott, Mark Swihart


