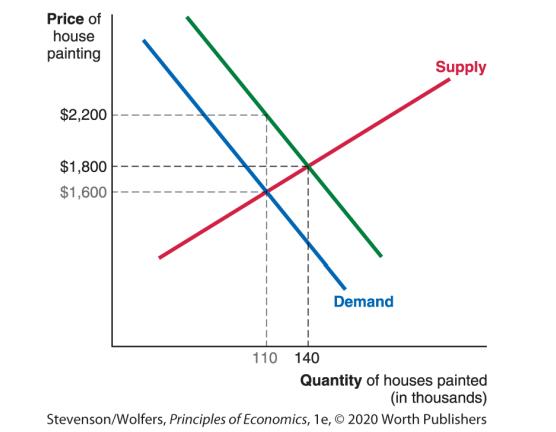
The graph below shows the market for house-painting services. Use it to answer the questions that follow.
Question:
The graph below shows the market for house-painting services. Use it to answer the questions that follow.

a. Painting the exterior of your house yields external benefits for your neighbors. Label the private marginal benefit and social marginal benefit curves and show the amount of the external benefit.
b. Show the equilibrium price and quantity.
c. What is the socially optimal quantity in this market?
d. Does the market produce too much or too little of this good relative to the socially optimal outcome? How much?
Fantastic news! We've Found the answer you've been seeking!
Step by Step Answer:
Related Book For 

Question Posted:


