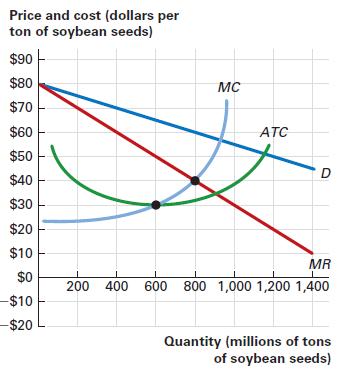
2.5 The figure illustrates the demand for soybean seeds, which your firms scientists genetically modified to be
Question:
2.5 The figure illustrates the demand for soybean seeds, which your firm’s scientists genetically modified to be resistant to herbicide sprays. The figure shows the demand curve (D), the marginal revenue curve (MR), the average total cost curve (ATC), and

the marginal cost curve (MC). Your supervisor wants to produce 600 million tons of seeds, the quantity that minimizes the average total cost.
a. Explain why your supervisor’s approach is incorrect.
b. How can you determine the profit-maximizing quantity?
c. According to the figure, what is the profitmaximizing price and quantity?
Fantastic news! We've Found the answer you've been seeking!
Step by Step Answer:
Related Book For 

Question Posted:


