Question:
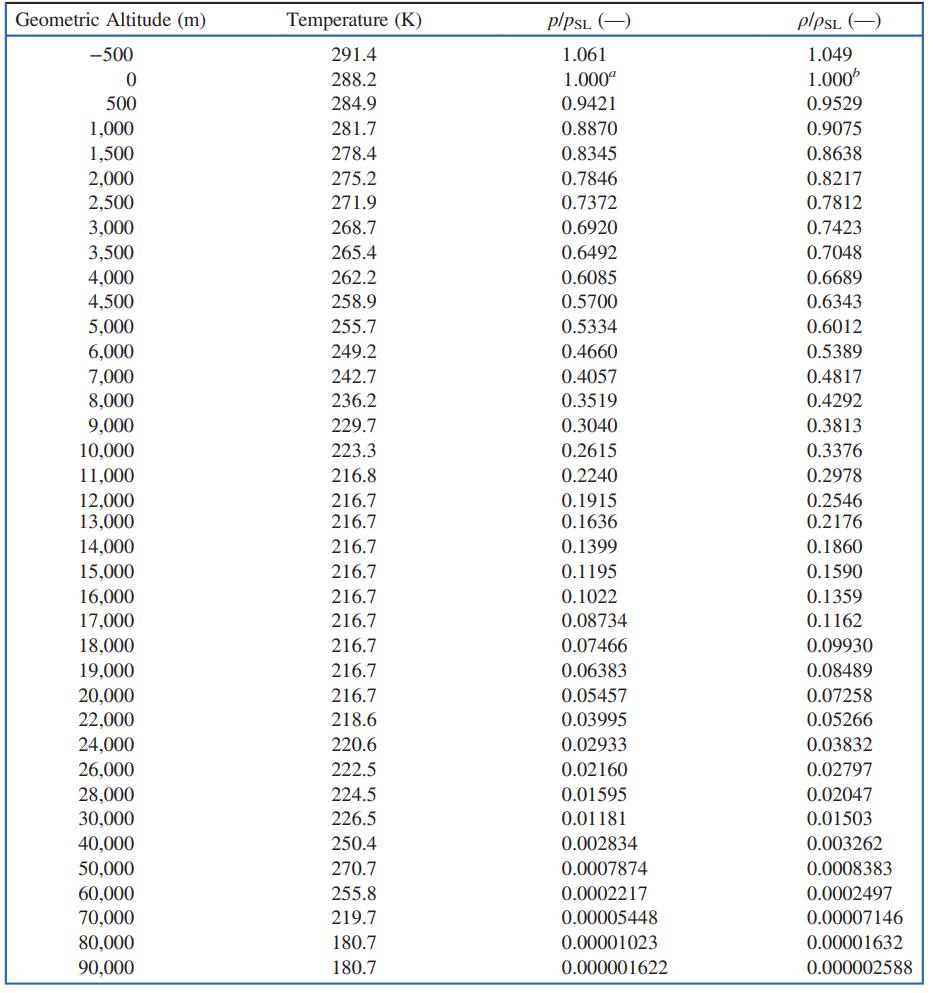
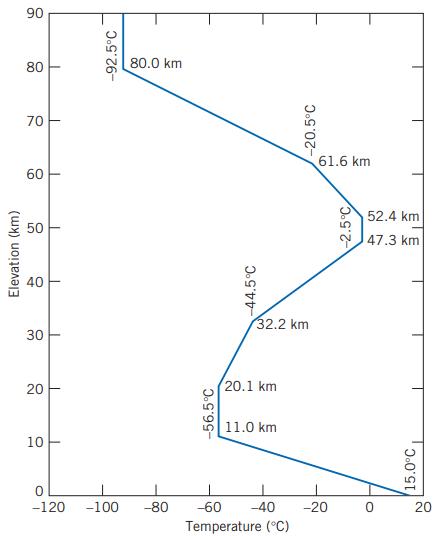
Based on the atmospheric temperature data of the U.S. Standard Atmosphere of Fig. 3.3, compute and plot the pressure variation with altitude, and compare with the pressure data of Table A.3.
Data From Table A.3

Data From Figure 3.3

Transcribed Image Text:
Geometric Altitude (m) -500 Temperature (K) P/PSL (-) plPSL (-) 291.4 1.061 1.049 0 288.2 1.000 1.000' 500 284.9 0.9421 0.9529 1,000 281.7 0.8870 0.9075 1,500 278.4 0.8345 0.8638 2,000 275.2 0.7846 0.8217 2,500 271.9 0.7372 0.7812 3,000 268.7 0.6920 0.7423 3,500 265.4 0.6492 0.7048 4,000 262.2 0.6085 0.6689 4,500 258.9 0.5700 0.6343 5,000 255.7 0.5334 0.6012 6,000 249.2 0.4660 0.5389 7,000 242.7 0.4057 0.4817 8,000 236.2 0.3519 0.4292 9,000 229.7 0.3040 0.3813 10,000 223.3 0.2615 0.3376 11,000 216.8 0.2240 0.2978 12,000 216.7 0.1915 0.2546 13,000 216.7 0.1636 0.2176 14,000 216.7 0.1399 0.1860 15,000 216.7 0.1195 0.1590 16,000 216.7 0.1022 0.1359 17,000 216.7 0.08734 0.1162 18,000 216.7 0.07466 0.09930 19,000 216.7 0.06383 0.08489 20,000 216.7 0.05457 0.07258 22,000 218.6 0.03995 0.05266 24,000 220.6 0.02933 0.03832 26,000 222.5 0.02160 0.02797 28,000 224.5 0.01595 0.02047 30.000 226.5 0.01181 0.01503 40,000 250.4 0.002834 0.003262 50,000 270.7 0.0007874 0.0008383 60,000 255.8 0.0002217 0.0002497 70,000 219.7 0.00005448 0.00007146 80,000 180.7 0.00001023 0.00001632 90,000 180.7 0.000001622 0.000002588


