

12.29 Systolic Blood Pressure (SBP) and Body Mass Index (BMI) In the case study of Chapter 1...
Question:
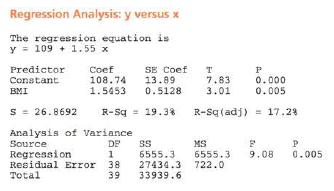
12.29 Systolic Blood Pressure (SBP) and Body Mass Index (BMI) In the case study of Chapter 1 we provided the blood pressure data on 500 persons (both male and females). Here we take a random sample of 40 persons. In the first column the blood pressure (y) and in the second column body mass index (x) were recorded for each randomly selected person. The data and MINITAB printout are shown in the following table.
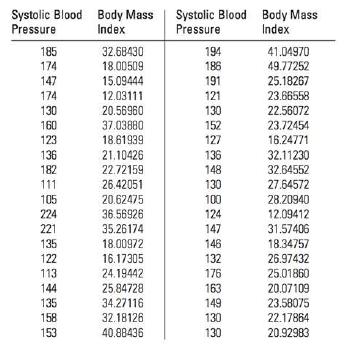
a. Construct a scatter plot of the data. Does the assumption of linearity appear to be reasonable?
b. What is the equation of regression line used for predicting SBP as the function of BMI?
c. Do the data present sufficient evidence to indicate that SBP measurement is linearly related to the BMI? Use a = 0.01.
d. Find a 99% confidence interval for the slope of the regression line.
Step by Step Answer:

This question has not been answered yet.
You can Ask your question!

Introduction To Probability And Statistics
ISBN: 9780176509804
3rd Edition
Authors: William Mendenhall
