

12.55 You are given these data: a. Plot the six points on graph paper. b. Calculate the...
Question:
12.55 You are given these data:
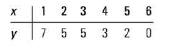
a. Plot the six points on graph paper.
b. Calculate the sample coefficient of correlation and interpret.
c. By what percentage was the sum of squares of deviations reduced by using the least-squares pre- dictor = a + bx rather than as a predictor of y?
Step by Step Answer:

This question has not been answered yet.
You can Ask your question!
Related Book For 
Introduction To Probability And Statistics
ISBN: 9780176509804
3rd Edition
Authors: William Mendenhall
Question Posted:
