

12.7 Six points have these coordinates: a. Find the least-squares line for the data. b. Plot the...
Question:
12.7 Six points have these coordinates:
![]()
a. Find the least-squares line for the data.
b. Plot the six points and graph the line. Does the line appear to provide a good fit to the data points?
c. Use the least-squares line to predict the value of y when x = 3.5.
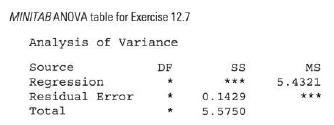
d. Fill in the missing entries in the MINITAB analysis of variance table.
Step by Step Answer:

This question has not been answered yet.
You can Ask your question!
Related Book For 
Introduction To Probability And Statistics
ISBN: 9780176509804
3rd Edition
Authors: William Mendenhall
Question Posted:
