

13.10 University Textbooks A publisher of university textbooks conducted a study to relate profit per text Y
Question:
13.10 University Textbooks A publisher of university textbooks conducted a study to relate profit per text Y to cost of sales x over a six-year period when its sales force (and sales costs) were growing rapidly. These inflation-adjusted data (in thousands of dollars) were collected: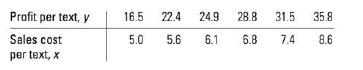
Expecting profit per book to rise and then plateau, the publisher fitted the model E(Y) = B+ Bx + Bx to the data.
a. Plot the data points. Does it look as though the qua- dratic model is necessary?
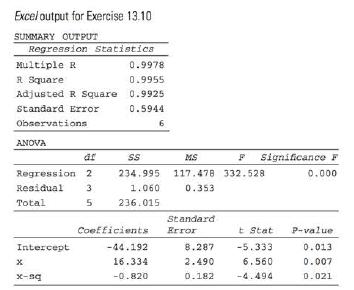
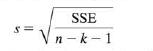
b. Find s on the printout. Confirm that
c. Do the data provide sufficient evidence to indicate that the model contributes information for the prediction of y? What is the p-value for this test, and what does it mean?
d. How much of the regression sum of squares is accounted for by the quadratic term? The linear term?
e. What sign would you expect the actual value of to have? Find the value of in the printout. Does this value confirm your expectation?
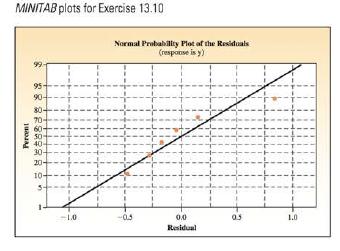
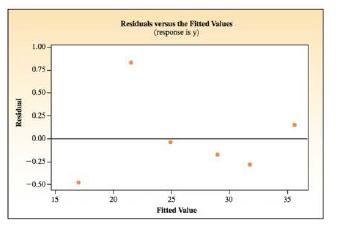
f. Do the data indicate a significant curvature in the relationship between y and x? Test at the 5% level of significance. g. What conclusions can you draw from the accompa- nying residual plots?
 \
\
Step by Step Answer:

This question has not been answered yet.
You can Ask your question!

Introduction To Probability And Statistics
ISBN: 9780176509804
3rd Edition
Authors: William Mendenhall
