

9.19 Independent random samples of 80 measure- ments were drawn from two quantitative populations, 1 and 2.
Question:
9.19 Independent random samples of 80 measure- ments were drawn from two quantitative populations, 1 and 2. Here is a summary of the sample data: 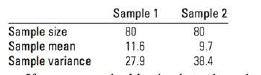
a. If your research objective is to show that , is larger than 2, state the alternative and the null hypotheses that you would choose for a statistical test.
b. Is the test in part a one- or two-tailed?
c. Calculate the test statistic that you would use for the test in part
a. Based on your knowledge of the stan- dard normal distribution, is this a likely or unlikely observation, assuming that He is true and the two population means are the same?
d. p-value approach: Find the p-value for the test. Test for a significant difference in the population means at the 1% significance level.
e. Critical value approach: Find the rejection region when a = 0.01. Do the data provide sufficient evi- dence to indicate a difference in the population means?
Step by Step Answer:


Introduction To Probability And Statistics
ISBN: 9780176509804
3rd Edition
Authors: William Mendenhall
