

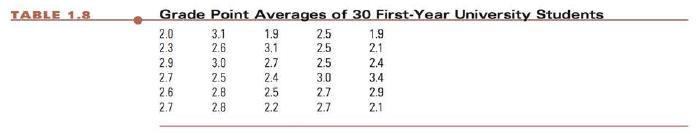
The data in Table 1.8 are the GPAs of 30 first-year university students, recorded at the end
Question:
The data in Table 1.8 are the GPAs of 30 first-year university students, recorded at the end of the first year. Construct a stem and leaf plot to display the distribution of the data.
Step by Step Answer:

This question has not been answered yet.
You can Ask your question!
Related Book For 
Introduction To Probability And Statistics
ISBN: 9780176509804
3rd Edition
Authors: William Mendenhall
Question Posted:
