Question:
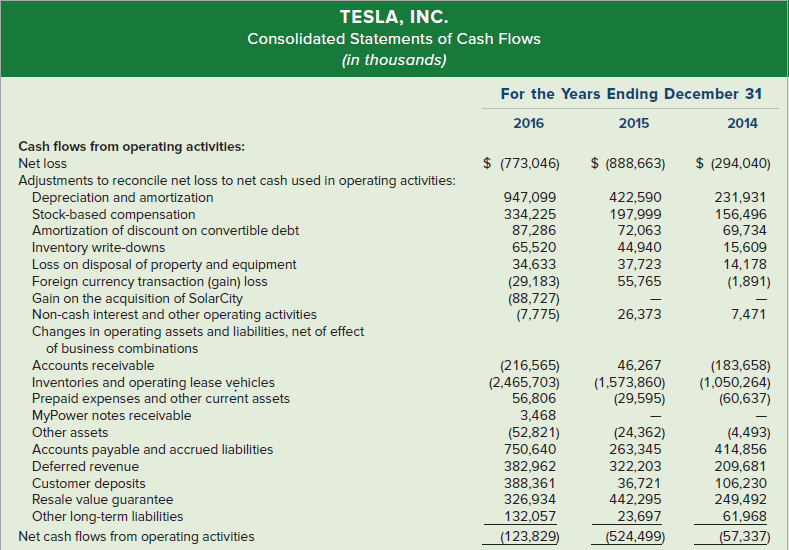
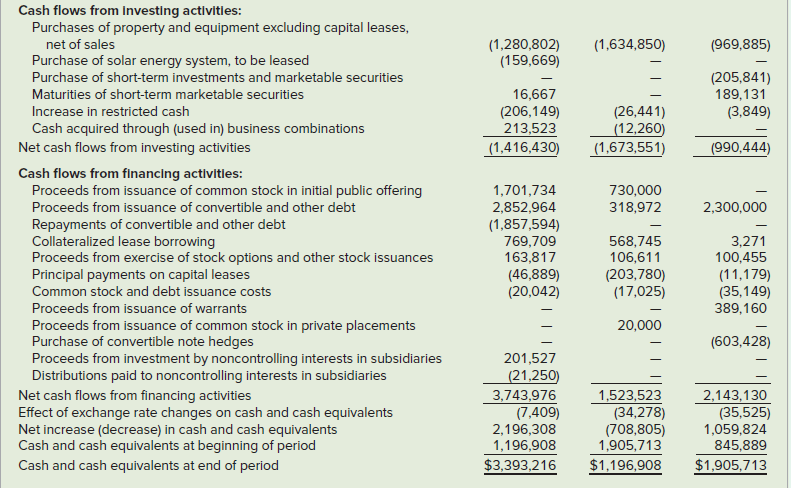
Tesla, Inc. began operations in 2003 but did not begin selling its stock to the public until June 28, 2010. It has lost money every year it has been in existence, and by December 31, 2016, it had total lifetime losses of approximately $3 billion. In addition to making automobiles, Tesla makes energy storage systems. Tesla’s statements of cash flows for 2014, 2015, and 2016 follow.
a. As this chapter explained, many companies that report net losses on their earnings statements report positive cash flows from operating activities. How do Tesla’s net incomes compare to its cash flows from operating activities?
b. Based only on the information in the statements of cash flows, does Tesla appear to be growing the capacity of its business? Explain.
c. In 2016, Tesla paid off $1.9 billion of “convertible and other debt.” Where did it get the funds to repay this debt?
d. All things considered, based on the information in its statements of cash flows, does Tesla’s cash position appear to be improving or deteriorating?


Transcribed Image Text:
TESLA, INC. Consolidated Statements of Cash Flows (in thousands) For the Years Ending December 31 2015 2016 2014 Cash flows from operating activitles: $ (773,046) $ (888,663) $ (294,040) Net loss Adjustments to reconcile net loss to net cash used in operating activities: Depreciation and amortization Stock-based compensation Amortization of discount on convertible debt Inventory write-downs Loss on disposal of property and equipment Foreign currency transaction (gain) loss Gain on the acquisition of SolarCity Non-cash interest and other operating activities Changes in operating assets and liabilities, net of effect 947,099 422,590 231,931 334,225 197,999 72,063 156,496 69,734 87,286 65,520 44,940 15,609 34,633 37,723 14,178 55,765 (29,183) (88,727) (7,775) (1,891) 26,373 7,471 of business combinations (216,565) (2,465,703) 56,806 Accounts receivable 46,267 (183,658) (1,050,264) (60,637) (1,573,860) (29,595) Inventories and operating lease vehicles Prepaid expenses and other current assets MyPower notes receivable Other assets 3,468 (52,821) 750,640 382,962 388,361 326,934 (24,362) 263,345 (4,493) 414,856 Accounts payable and accrued liabilities Deferred revenue 322,203 209,681 Customer deposits Resale value guarantee Other long-term liabilities Net cash flows from operating activities 36,721 442,295 106,230 249,492 132,057 23,697 61,968 (57,337) (123,829) (524,499) Cash flows from Investing activities: Purchases of property and equipment excluding capital leases, net of sales (1,634,850) (1,280,802) (159,669) (969,885) Purchase of solar energy system, to be leased Purchase of short-term investments and marketable securities (205,841) 189,131 16,667 (206,149) 213,523 (1,416,430) Maturities of short-term marketable securities Increase in restricted cash (26,441) (12,260) (1,673,551) (3,849) Cash acquired through (used in) business combinations Net cash flows from investing activities (990,444) Cash flows from financing activitles: Proceeds from issuance of common stock in initial public offering 730,000 318,972 1,701,734 2,852,964 (1,857,594) 769,709 163,817 Proceeds from issuance of convertible and other debt 2,300,000 Repayments of convertible and other debt Collateralized lease borrowing Proceeds from exercise of stock options and other stock issuances Principal payments on capital leases 568,745 106,611 3,271 100,455 (11,179) (35,149) 389,160 (46,889) (20,042) (203,780) (17,025) Common stock and debt issuance costs Proceeds from issuance of warrants 20,000 Proceeds from issuance of common stock in private placements Purchase of convertible note hedges Proceeds from investment by noncontrolling interests in subsidiaries Distributions paid to noncontrolling interests in subsidiaries (603,428) 201,527 Net cash flows from financing activities Effect of exchange rate changes on cash and cash equivalents Net increase (decrease) in cash and cash equivalents Cash and cash equivalents at beginning of period (21,250) 3,743,976 (7,409) 2,196,308 1,196,908 1,523,523 (34,278) (708,805) 1,905,713 2,143,130 (35,525) 1,059,824 845,889 Cash and cash equivalents at end of period $3,393,216 $1,196,908 $1,905,713


