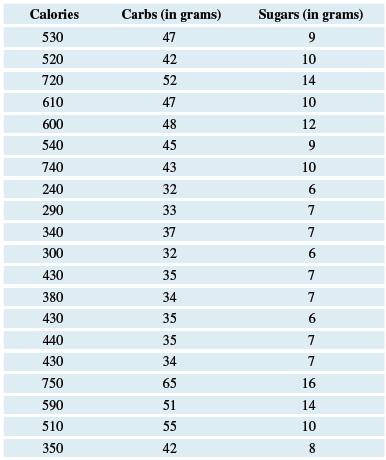
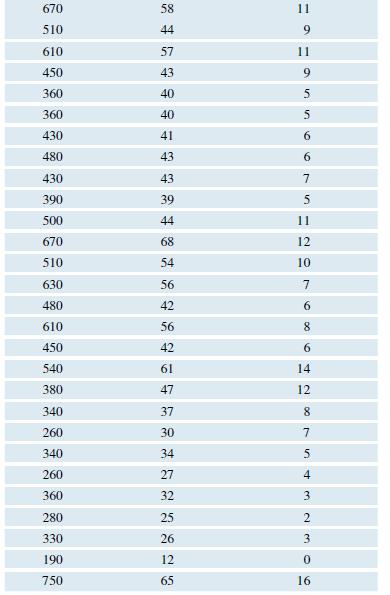
The data shows the number of calories, carbohydrates (in grams) and sugar (in grams) found in a
Question:
The data shows the number of calories, carbohydrates (in grams) and sugar (in grams) found in a selection of menu items at McDonald’s. Scatterplots suggest the relationship between calories and both carbs and sugars is linear. The data are also available on this text’s website.


a. Calculate the correlation coefficient and report the equation of the regression line using carbs as the predictor and calories as the response variable. Report the slope and interpret it in the context of this problem. Then use your regression equation to predict the number of calories in a menu item containing 55 grams of carbohydrates.
b. Calculate the correlation coefficient and report the equation of the regression line using sugar as the predictor and calories as the response variable. Report the slope and interpret it in the context of this problem. Then use your regression equation to predict the number of calories in a menu item containing 10 grams of sugars.
c. Based on your answers to parts (a) and (b), which is a better predictor of calories for these data: carbs or sugars? Explain your choice using appropriate statistics.
Step by Step Answer:

Introductory Statistics Exploring The World Through Data
ISBN: 9780135163146
3rd Edition
Authors: Robert Gould, Rebecca Wong, Colleen N. Ryan


