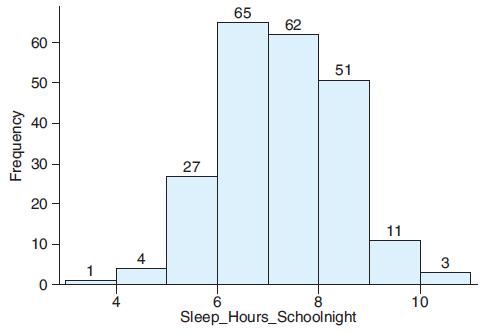
The histogram shows hours of sleep on a school night for a sample of 12th-grade students. a.
Question:
The histogram shows hours of sleep on a school night for a sample of 12th-grade students.
a. Use the histogram and left-hand side of each bin to estimate the mean hours (to the nearest tenth) of sleep for 12th-graders on a school night.
b. When comparing the mean and the median for this data set, would you expect these two values to be fairly similar or would you expect that one is much greater than the other? Explain.

Fantastic news! We've Found the answer you've been seeking!
Step by Step Answer:
Related Book For 

Introductory Statistics Exploring The World Through Data
ISBN: 9780135163146
3rd Edition
Authors: Robert Gould, Rebecca Wong, Colleen N. Ryan
Question Posted:


