

Question: The histograms below were created from data on the daily high temperature in San Jose and Denver during a winter month. Compare the two distributions.
The histograms below were created from data on the daily high temperature in San Jose and Denver during a winter month. Compare the two distributions. Which city do you think has the higher typical temperature? Which city has more variation in temperature? Explain. (Source: Accuweather.com)
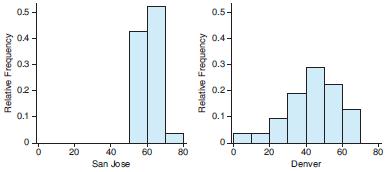
0.5 0.5- 0.4 0.4- 0.3 0.3- 02 0.2 0.1 0.1 20 40 60 80 20 40 60 80 San Jose Denver Relative Frequency Relative Frequency
Step by Step Solution
3.33 Rating (162 Votes )
There are 3 Steps involved in it
a San Jose has the highest typical temperature because you can s... View full answer

Get step-by-step solutions from verified subject matter experts