

Assuming the following data, what is the correlation coefficient and how would this be interpreted? Variance of
Question:
Assuming the following data, what is the correlation coefficient and how would this be interpreted?
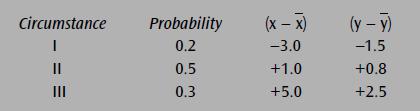
Variance of x = 8.02 Variance of y = 2.30
(A) 0.961, very high positive correlation
(B) 0.121, very little correlation
(C) –0.961, very high negative correlation (D) –0.121, very low negative correlation (E) 0.690, some positive correlation
Fantastic news! We've Found the answer you've been seeking!
Step by Step Answer:

Answered By
Jinah Patricia Padilla
Had an experience as an external auditor in Ernst & Young Philippines and currently a Corporate Accountant in a consultancy company providing manpower to a 5-star hotel in Makati, Philippines, Makati Diamond Residences
120+ Reviews
150+ Question Solved
Related Book For 

Question Posted:
