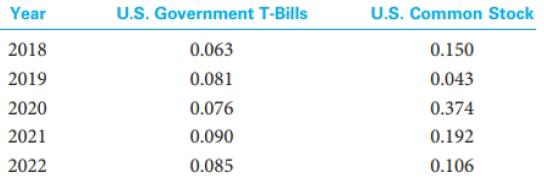
The following are annual rates of return for U.S. government T-bills and U.S. common stocks. a. Compute
Question:
The following are annual rates of return for U.S. government T-bills and U.S. common stocks.

a. Compute the arithmetic mean rate of return and standard deviation of rates of return for the two series.
b. Discuss these two alternative investments in terms of their arithmetic average rates of return, their absolute risk, and their relative risk.
c. Compute the geometric mean rate of return for each of these investments. Compare the arithmetic mean return and geometric mean return for each investment and discuss the difference between mean returns as related to the standard deviation of each series.
Fantastic news! We've Found the answer you've been seeking!
Step by Step Answer:
Related Book For 

Investment Analysis and Portfolio Management
ISBN: 978-1305262997
11th Edition
Authors: Frank K. Reilly, Keith C. Brown, Sanford J. Leeds
Question Posted:


