The data set contains values of seven variables for 10 states in the United States. The seven
Question:
The data set contains values of seven variables for 10 states in the United States. The seven variables are 1. Population size divided by 1000 2. Average per capita income 3. Illiteracy rate (% population)
4. Life expectancy (years)
5. Homicide rate (per 1000)
6. Percentage of high school graduates 7. Average number of days per year below freezing
• Construct a scatterplot matrix of the data, labeling the points by state name.
• On each panel of the scatterplot matrix show the corresponding bivariate boxplot.
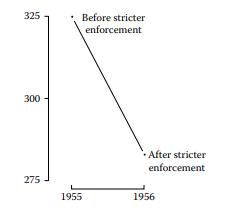
• Construct a coplot of life expectancy and homicide rate conditional on average per capita income. 2.4 Figure 2.41 shows the traffic deaths in a particular area before and after stricter enforcement of the speed limit by the police. Does the graph convince you that the efforts of the police have had the desired effect of reducing road traffic deaths? If not, why not?

Step by Step Answer:

Multivariate Analysis For The Behavioral Sciences
ISBN: 9781351202251
2nd Edition
Authors: Kimmo Vehkalahti, Brian S Everitt


