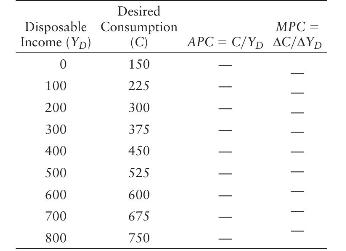
Consider the following table showing aggregate consumption expenditures and disposable income. All values are expressed in billions
Question:
Consider the following table showing aggregate consumption expenditures and disposable income. All values are expressed in billions of constant dollars.

a. Compute the average propensity to consume for each level of income and fill in the table.
b. Compute the marginal propensity to consume for each successive change in income and fill in the table.
c. Plot the consumption function on a scale diagram. What is its slope?
Step by Step Answer:
Related Book For 

Question Posted:


