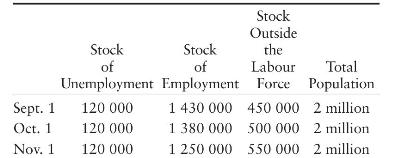
The table below provides employment and labour force data for a small economy over a 3 -month
Question:
The table below provides employment and labour force data for a small economy over a 3 -month period.

a. What is the unemployment rate on September 1 , October 1 , and November 1 ?
b. Explain why the unemployment rate changes even though the stock of unemployment remains stable.
c. Provide a likely explanation for the change in this economy's labour force. In this case, is the unemployment rate an accurate measure of the amount of slack (excess supply) in the labour market?
Fantastic news! We've Found the answer you've been seeking!
Step by Step Answer:
Related Book For 

Question Posted:


