Question:
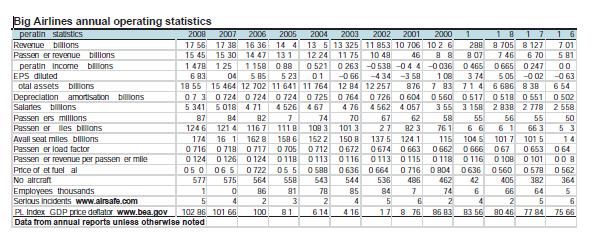
Building a balanced scorecard: Big Airline, Inc Big Airline publishes annual operating statistics, as do most airlines. Refer to the data table for an overview of all operating statistics available for the last ten years. Consider these to be key performance indicators (KPIs).

1. Hypothesise that these operating statistics can be fashioned into a Balanced Scorecard.
Draw a strategy map that displays the hypothesised linkages among the airline’s KPIs.
2. Test whether the hypothesised linkages are statistically significant, as predicted.
3. Revise the strategy map with hypothesised linkages from the first requirement to a strategy map that represents the statistically significant linkages you found under the second requirement.
4. Discuss whether the original and the revised strategy maps would be reliable and useful as a balanced scorecard for Big Airline.
Transcribed Image Text:
Big Airlines annual operating statistics peratin statistics Revenue billions Passen er revenue billions peratin Income billons EPS diluted otal assets billions Depreciation amortisation billions Salaries billons Passen ers millions Passen er lles billons Avall seat miles billions Passen er load factor Passen er revenue per passen er mile 2008 2007 2006 2005 2004 2003 2002 2001 2000 16 1756 17 38 16 36 14 4 15 45 15 30 14 47 131 12 24 11 75 10 48 1478 125 1158 088 0 521 13 5 13 325 11 853 10 706 0 263-0538-044-0036 10 2 6 288 8 705 8 127 701 46 88 8 07 746 670 5 81 0465 0665 0247 00 683 04 585 5 23 18 55 15 464 12 702 11 641 01 11 764 -066 -434 -358 108 3 74 505 -002 -063 12 84 12 257 876 7 83 714 6 686 8 38 654 07 3 0 724 0 724 0724 0 725 0 764 0726 0 604 0 560 0517 0518 0551 0502 5 341 5018 4.71 4 526 467 4 76 4562 4 057 3 55 3 158 2 838 2 778 2558 87 1246 84 1214 82 7 74 70 67 62 58 55 56 55 50 1167 111 B 109 3 1013 27 82 3 76 1 66 61 66 3 5 3 174 16 1 1628 1586 152 2 150 8 137 5 124 1 115 104 5 101 7 1015 14 0716 0718 0717 0705 0712 0672 0674 0663 0662 0666 067 0 653 064 0124 0126 0124 0118 0113 0116 0113 0115 0118 0116 0108 0 101 008 050 06 5 0722 05 5 0588 0636 0664 0716 0804 0636 0560 0578 0562 517 575 564 558 543 544 536 486 462 42 405 382 364 1 0 86 81 78 85 84 7 74 6 66 64 5 5 4 2 3 2 4 5 6 2 4 2 5 6 102 86 101 66 100 81 614 416 17 8 76 86 83 83 56 80 46 7784 75 66 Price of et fuel al No aircraft Serious Incidents www.airsafe.com Employees thousands PL Index GDP price deflator www.bea.gov Data from annual reports unless otherwise noted


