Question:
Business model
‘Debt covenants at risk for Overlevered Corp’
Posted 13 October 2010 @ 04:05 pm EST An analyst said Monday Overlevered Corp is in danger of violating debt covenants as sales in the industry sink amid the global economic slowdown.
“Based on our revised forecasts, we estimate that could trip debt covenants in the December quarter,” ABC Capital Markets analyst Aaron Burr told investors in a research note. “We expect that the company will be able to manage through these issues, but the risk profile has certainly changed in the past few months.”
Burr cut his price target on Overlevered to $7 from $13, citing the manufacturer's “deteriorating earnings outlook and growing balance sheet stress. The primary risk to our price target is that Overlevered is not successful in negotiating with its lenders to ensure sufficient liquidity.”
From Overlevered Corporation's 2009 Form 10-K
“The Company has a $650.0 million long-term revolving credit facility (Facility) with a group of banks.... Under the terms of the Facility, Overlevered is subject to a leverage test, as well as restrictions on secured debt. The Company was in compliance with these covenants at December 31, 2009.”
Assume that the leverage constraint is the debt to equity ratio, total debt divided by stockholders' equity, which cannot exceed 40% at year's end.
Required:
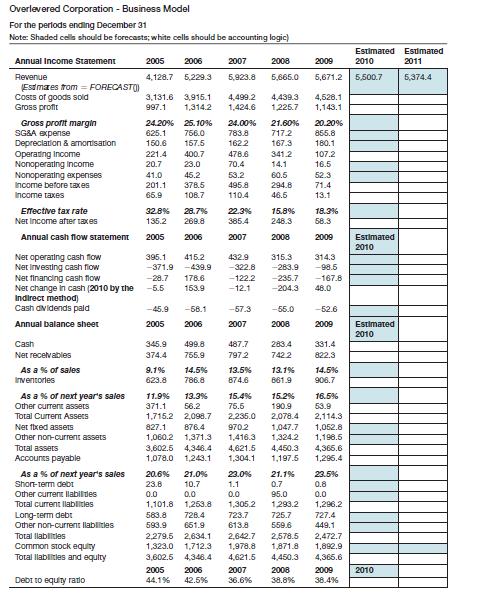
1. Prepare input model estimates of the financial parameters in the shaded boxes on the following business model. Explain your method(s) for making these estimates. Note: Not all variables should be forecasted; some variables should be computed from forecasted values using accounting logic.

Transcribed Image Text:
Overlevered Corporation - Business Model For the periods ending December 31 Note: Shaded cells should be forecasts; white cells should be accounting logic) Annual Income Statement 2005 2006 2007 2008 2009 2010 Estimated Estimated 2011 Revenue 4,128.7 5,229.3 5,923.8 5,665.0 5,671.2 5,500.7 5,374.4 (Estimates from FORECAST() Costs of goods sold 3,131.6 3,915.1 4,499.2 4,439.3 4,528.1 Gross profit 997.1 1,314.2 1,424.6 1,225.7 1,143.1 Gross profit margin 24.20% 25.10% 24.00% 21.60% 20.20% SG&A expense 625.1 756.0 783.8 717.2 855.8 Depreciation & amortisation 150.6 157.5 162.2 167.3 180.1 Operating Income 221.4 400.7 478.6 341.2 107.2 Nonoperating Income 20.7 23.0 70.4 14.1 16.5 Nonoperating expenses 41.0 45.2 53.2 60.5 52.3 Income before taxes 201.1 378.5 495.8 294.8 71.4 Income taxes 65.9 108.7 110.4 46.5 13.1 Effective tax rate 32.8% 28.7% 22.3% 15.8% 18.3% Net Income after taxes 135.2 269.8 385.4 248.3 58.3 Annual cash flow statement 2005 2006 2007 2008 2009 Estimated 2010 Net operating cash flow 395.1 415.2 432.9 315.3 314.3 Net Investing cash flow -371.9 -439.9 -322.8 -283.9 -98.5 Net financing cash flow -28.7 178.6 -122.2 -235.7 -167.8 Net change in cash (2010 by the -5.5 153.9 -12.1 -204.3 48.0 Indirect method) Cash dividends paid -45.9 -58.1 -57.3 -55.0 -52.6 Annual balance sheet 2005 2006 2007 2008 2009 Estimated 2010 Cash 345.9 499.8 487.7 283.4 331.4 Net receivables 374.4 755.9 7972 742.2 822.3 As a % of sales 9.1% 14.5% 13.5% 13.1% 14.5% Inventories 623.8 786.8 874.6 661.9 906.7 As a % of next year's sales 11.9% 13.3% 15.4% 15.2% 16.5% Other current assets 371.1 56.2 75.5 190.9 53.9 Total Current Assets 1,715.2 2,098.7 2,235.0 2,078.4 2,114.3 Net fixed assets 827.1 876.4 970.2 1,047.7 1,052.8 Other non-current assets Total assets 1,060.2 1,371.3 3,602.5 4,346.4 1,416.3 1,324.2 1,198.5 4,621.5 4,450.3 4,365.6 Accounts payable 1,078.0 1,243.1 1,304.1 1,197.5 1,296.4 As a % of next year's sales 20.6% 21.0% 23.0% Short-term debt 23.8 10.7 1.1 Other current liabilities 0.0 0.0 0.0 21.1% 0.7 95.0 23.5% 0.8 0.0 Total current liabilities 1,101.8 1,253.8 1,305.2 1,293.2 1,296.2 Long-term debt 583.8 728.4 723.7 725.7 727.4 Other non-current liabilities 593.9 651.9 613.8 559.6 449.1 Total flabilities 2,279.5 2,634.1 2,642.7 2,578.5 2,472.7 Common stock equity 1,323.0 1,712.3 1,978.8 1,871.8 1,892.9 Total llablities and equity Debt to equity ratio 3,602.5 4,348.4 4,621.5 4,450.3 4,365.6 2005 44.1% 2006 2007 2008 2009 2010 42.5% 36.6% 38.8% 38.4%


