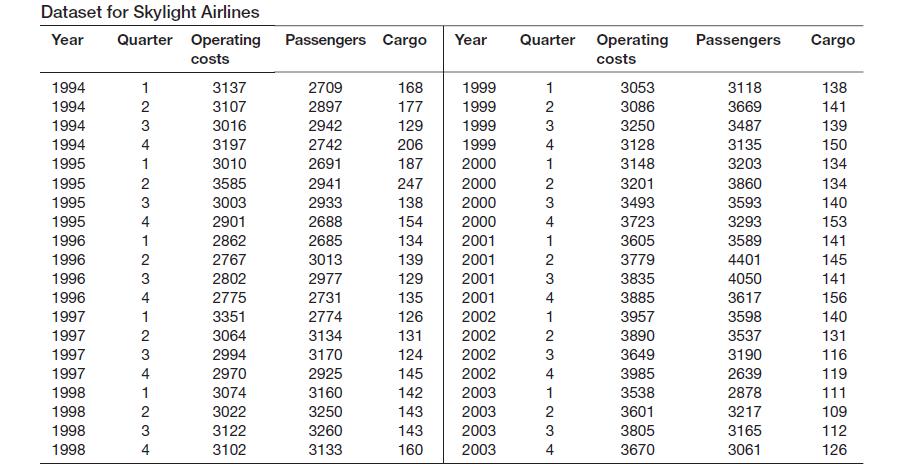
Skylight Airlines The dataset includes nine years of quarterly data about costs on two different cost drivers
Question:
Skylight Airlines The dataset includes nine years of quarterly data about costs on two different cost drivers of an airline company. The dataset includes the operational costs in thousands of dollars in each quarter from 1994 until 2003, the number of passengers transported, and the tons of cargo shipped in the quarters. As a controller you should analyse the cost structure of this airline company.

1. Plot the data, do you see a clear relationship between the cost drivers and the operational costs?15 2. Test whether the number of passengers and the number of cargo shipped are reliable cost drivers for the firm. Which part of the costs are fixed cost and which part are variable costs when these two cost drivers are used?
3. Reflect on the quality of the regression equation. Does the regression meet its assumptions?
Where do you see problems? Hint: Also plot the residuals against time, and against the predicted values of the operational costs.
4. The airplane industry was hit very hard by the attacks on the World Trade Centre in the 3rd quarter of 2001. This led to a decrease in both passengers and cargo shipped. Since Skylight Airlines had problems to adjust their costs downwards very rapidly they ran into problems. How do you model such a sudden shift in these time series? Assess the impact of this crisis on the airlines’s costs.
5. Is there a seasonal pattern in the costs that is unrelated to the cost drivers? Examine what the impact of seasonality is on the cost pattern.
Step by Step Answer:


