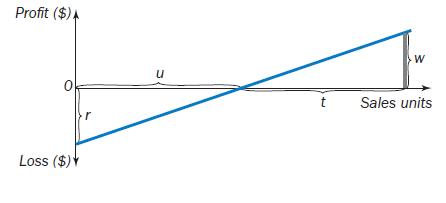
The diagram shows the profitvolume chart of Z Ltd for its last accounting period. The company made
Question:
The diagram shows the profit–volume chart of Z Ltd for its last accounting period. The company made a profit of $w during the period.

(a) An increase in the fixed costs per period (assuming the selling price per unit and the variable cost per unit remain unchanged), will result in:
(i) a reduction in r (ii) an increase in w (iii) a reduction in t (iv) no change in u
(b) The following results were achieved in the last accounting period:
r = $50,000 w = $16,000 t = 800 units u = 2,500 units The company expects to make and sell an additional 1,400 units in the next accounting period. If variable cost per unit, selling price per unit and total fixed costs remain unchanged, the effect on profit will be:
(i) an increase of $10,500 (ii) an increase of $21,210 (iii) an increase of $28,000 (iv) an increase of $87,500
Step by Step Answer:

Management Accounting For Business
ISBN: 9781138550650
8th Edition
Authors: Colin Drury, Mike Tayles


