Intermediate: Profit-volume graph and changes in sales mix A company produces and sells two products with the
Question:
Intermediate: Profit-volume graph and changes in sales mix A company produces and sells two products with the following costs: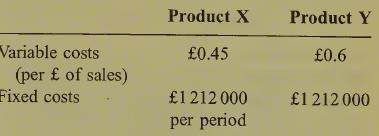
Required:
(a) Calculate the break-even sales revenue per period, based on the sales mix assumed above.
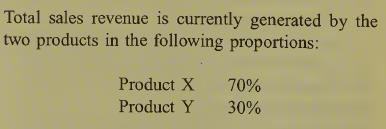
(b) Prepare a profit-volume chart of the above situation for sales revenue up to £4000000. Show on the same chart the effect of a change in the sales mix to product X 50%, product Y 50%. Clearly indicate on the chart the break¬ even point for each situation. (11 marks)
(c) Of the fixed costs £455 000 are attributable to product X. Calculate the sales revenue required on product X in order to recover the attributable fixed costs and provide a net contribution of £700000 towards general fixed costs and profit.LO1
Step by Step Answer:

This question has not been answered yet.
You can Ask your question!