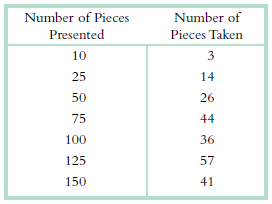
See the description of Holidays experiment in Exercise 13.35. We calculated the correlation coefficient for the relation
Question:

a. Draw a scatterplot for these data. Does the scatterplot suggest that it is appropriate to calculate a Pearson correlation coefficient? Explain.
b. Calculate the Pearson correlation coefficient.
c. State what the Pearson correlation coefficient tells us about the relation between these two variables.
d. Explain why the pattern of pairs of deviation scores enables us to understand the relation between the two variables. (That is, consider whether pairs of deviation scores tend to share the same sign or to have opposite signs.)
e. Explain how the relations between the perception of a situation as traumatic and the perception of a woman as either masculine or feminine differ from those same relations with respect to men.
Step by Step Answer:

Essentials Of Statistics For The Behavioral Sciences
ISBN: 9781464107771
3rd Edition
Authors: Susan A. Nolan


