

Tuscaloosa Brickworks uses variance analysis to track materials price and quantity variances. Managers recognize that normal fluctuations
Question:
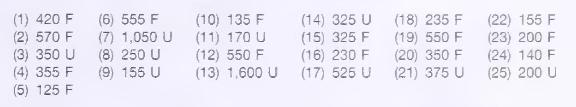
Tuscaloosa Brickworks uses variance analysis to track materials price and quantity variances. Managers recognize that normal fluctuations occur, but want to investigate the cause of sig- nificant favorable or unfavorable variances. To help them assess whether a variance is signif- icant, managers use statistical process control charts. Materials price variance data are presented for 25 periods as follows:
\section*{Required}
A. Prepare a statistical process control chart to evaluate whether materials price variances are in a state of statistical control. Use positive values for favorable variances and negative values for unfavorable variances. To solve the problem using Minitab, use the following instructions: Open Minitab. Enter observations 1-25 in column C1. Click on Stat. Click on Control Charts. Click on Individuals. Enter C1 into Variable field. Click OK.
Note: If you choose to solve the problem manually (or to use Excel), upper and lower control limits should be placed on your graph at \(Y\)-axis values 1,564 and \(-1,572\), respectively. Refer to Exhibit 12 in this chapter for an illustration of control limit and process average placement. You may manually calculate the process average or use the average function within Excel.
B. Which, if any, observations should management investigate?
C. Is the process subject to common and special cause variation? Explain.
D. Typically, who is responsible for a significant materials price variance? Explain.
Step by Step Answer:

This question has not been answered yet.
You can Ask your question!

Managerial Accounting Information For Decisions
ISBN: 9780324222432
4th Edition
Authors: Thomas L. Albright , Robert W. Ingram, John S. Hill
