

Question: Refer to the Camp Sunshine data presented in E5-9. Required: 1. Perform a least-squares regression analysis on Camp Sunshines data. 2. Using the regression output,
Refer to the Camp Sunshine data presented in E5-9.
Required:
1. Perform a least-squares regression analysis on Camp Sunshine’s data.
2. Using the regression output, create a cost equation (Y = A + BX) for estimating Camp Sun¬ shine’s operating costs.
3. Using the least-squares regression results, calculate the camp’s expected operating cost if 85 children attend a session.
4. Compare this estimated cost to the actual cost incurred during week 7. Explain why these numbers might differ.
Data from E5-9
Camp Sunshine offers overnight summer camp programs for children ages 10-14 every summer during June and July. Each camp session is one week and can accommodate up to 100 children. The camp is not coed, so hoys attend during the odd-numbered weeks and girls attend during the even-numbered weeks. While at the camp, participants make crafts, participate in various sports, help care for the camp’s resident animals, have cookouts and hayrides, and help assemble toys for local underprivileged children.
The camp provides all food as well as materials for all craft classes and the toys to be assembled. One cabin can accommodate up to 10 children, and one camp counselor is assigned to each cabin. Three camp managers are on-site regardless of the number of campers enrolled.
Following is the cost information for Camp Sunshine’s operations last summer:
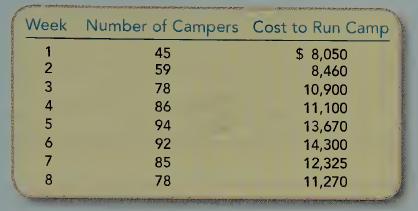
Week Number of Campers Cost to Run Camp 45 $ 8,050 12345678 59 8,460 78 10,900 86 11,100 94 13,670 92 14,300 85 12,325 78 11,270
Step by Step Solution
There are 3 Steps involved in it
SureI can help you with thatLeastsquares regression analysis is a mathematical technique that helps you find a line or curve that best fits a set of data pointsThe equation for the the straight line i... View full answer

Get step-by-step solutions from verified subject matter experts