

Question: Refer to the Wendys Widgets data in M5-7. Using the high-low method, calculate the total fixed cost per month and the variable cost per widget.
Refer to the Wendy’s Widgets data in M5-7. Using the high-low method, calculate the total fixed cost per month and the variable cost per widget. How does the estimate of fixed cost compare to what you estimated in M5-7?
Data from M5-7
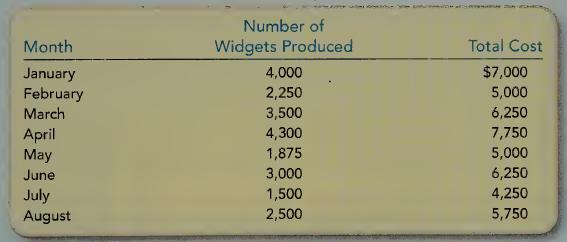
Wendy’s Widgets builds the world’s best widgets. Information for the last eight months follows:
Prepare a scattergraph by plotting Wendy’s data on a graph. Then draw a line that you believe best fits the data points. Using the graph and line you have drawn, estimate Wendy’s total fixed cost per month.
Month January February March Number of Widgets Produced 4,000 Total Cost $7,000 2,250 5,000 3,500 6,250 April 4,300 7,750 May 1,875 5,000 June 3,000 6,250 July 1,500 4,250 August 2,500 5,750
Step by Step Solution
There are 3 Steps involved in it

Get step-by-step solutions from verified subject matter experts