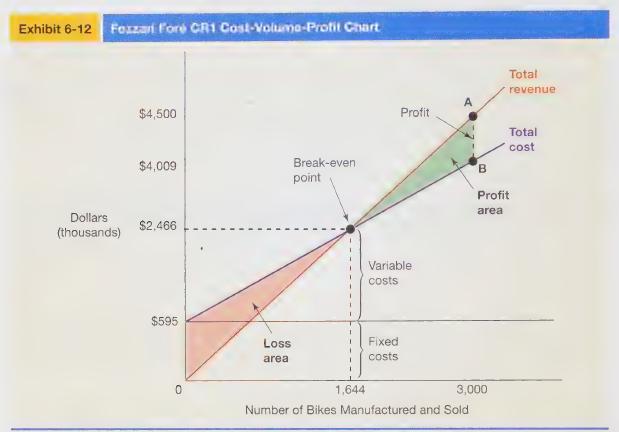
Set up a break-even chart similar to the one in Exhibit 6-12 with proportional scales from zero
Question:
Set up a break-even chart similar to the one in Exhibit 6-12 with proportional scales from zero to \($72,000\) (in \($12,000\) increments) on the vertical axis and from zero to 12,000 units of production (in 2,000-unit increments) on the horizontal axis. Prepare the break-even chart for Morton Company, assuming total fixed costs of \($18,000\) and unit selling price and unit variable cost for the company’s one product of \($6\) and \($4,\) respectively. Label the total revenue line and the total cost line. Indicate the break-even point in units and dollars.

Fantastic news! We've Found the answer you've been seeking!
Step by Step Answer:
Related Book For 

Managerial Accounting For Undergraduates
ISBN: 9780357499948
2nd Edition
Authors: James Wallace, Scott Hobson, Theodore Christensen
Question Posted:


