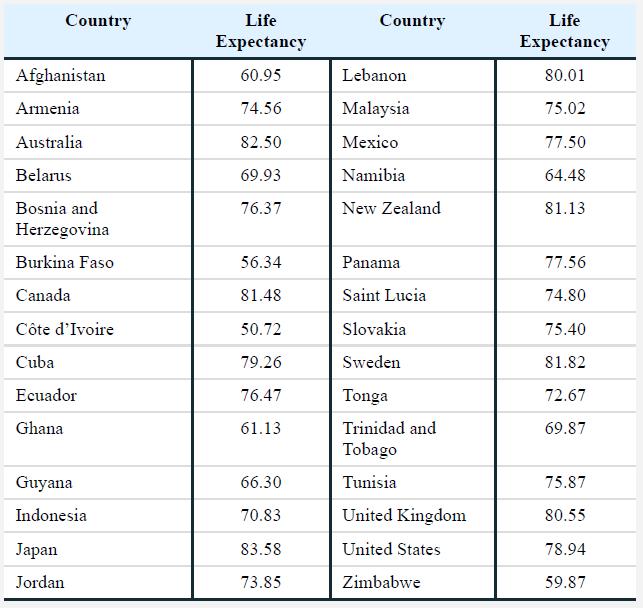
The United Nations Development Programme (2015b) published life expectancy ratesthe number of years an adult can expect
Question:
The United Nations Development Programme (2015b) published life expectancy rates—the number of years an adult can expect to live—for 195 countries around the world. Below is a randomly selected sample of 30 of them.

a. Create a grouped frequency table for these data.
b. The data have quite a range, with the lowest life expectancy of 50.72 in Côte d’Ivoire and the highest life expectancy of 83.58 in Japan. What research hypotheses come to mind when you examine these data? State at least one research question that these data suggest to you.
c. Create a grouped histogram for these data. As always, be careful when determining the midpoints of the intervals.
d. Examine the histogram and give a brief description of the distribution. Are there unusual scores? Are the data symmetric, or are they skewed? If they are skewed, in which direction?
Step by Step Answer:

Statistics For The Behavioral Sciences
ISBN: 9781319190743
5th Edition
Authors: Susan A. Nolan, Thomas Heinzen


