

Question: An x chart based on standard deviations (instead of ranges) is constructed by plotting sample means with a centerline at x and control limits at
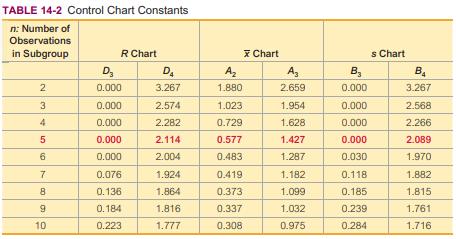
An x̅̅ chart based on standard deviations (instead of ranges) is constructed by plotting sample means with a centerline at x̅̅ and control limits at x̅̅ + A3x̅ and x̅̅ - A3x̅, where A3 is found in Table 14-2 on page 660 and x̅ is the mean of the sample standard deviations. Use the data in Table 14-1 on page 655 to construct an x̅̅ chart based on standard deviations. Compare the result to the x̅̅ chart based on sample ranges in Example 5 “x̅ Chart of Altimeter Errors.”
Table 14-1:
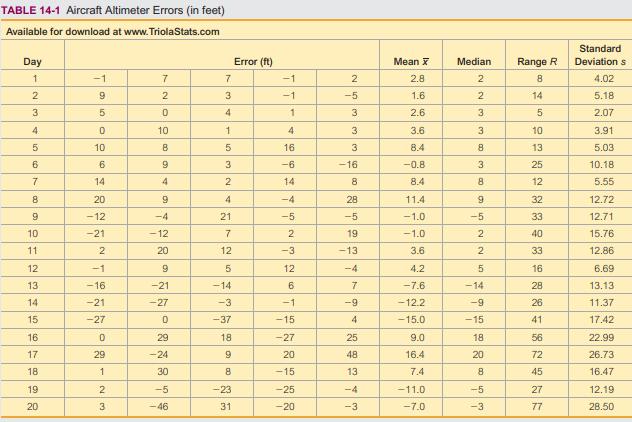
Table 14-2:
Step by Step Solution
★★★★★
3.39 Rating (152 Votes )
There are 3 Steps involved in it
1 Expert Approved Answer
Step: 1 Unlock

Question Has Been Solved by an Expert!
Get step-by-step solutions from verified subject matter experts
Step: 2 Unlock
Step: 3 Unlock