Question: Exercises 58 in Section 14-1 used process data from the manufacture of 0.0109-in.-thick aluminum cans. Refer to Data Set 30 Aluminum Cans in Appendix B
Exercises 5–8 in Section 14-1 used process data from the manufacture of 0.0109-in.-thick aluminum cans. Refer to Data Set 30 “Aluminum Cans” in Appendix B and conduct an analysis of the process data for the cans that are 0.0111 in. thick. The values in the data set are the measured axial loads of cans, and the top lids are pressed into place with pressures that vary between 158 lb and 165 lb. The 175 axial loads are in one column, the first 7 are from the first day, the next 7 are from the second day, and so on, so that the “subgroup size” is 7.
Analyzing the Results
Based on the given process data, should the company take any corrective action? Write a report summarizing your conclusions. Address not only the issue of statistical stability but also the ability of the cans to withstand the pressures applied when the top lids are pressed into place. Also compare the behavior of the 0.0111-in. cans to the behavior of the 0.0109-in. cans, and recommend which thickness should be used.
Data Set 30: Aluminum Cans
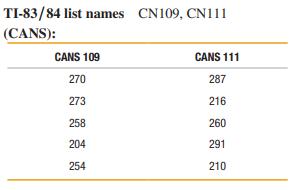
Data are from 350 cans (first five rows shown here) consisting of measured maximum axial loads (pounds). Axial loads are applied when the tops are pressed into place. CANS 109 includes cans that are 0.0109 inch thick, and CANS 111 includes cans that are 0.0111 inch thick.

Step by Step Solution
3.32 Rating (158 Votes )
There are 3 Steps involved in it
ANSWER Lets analyze the process data for the aluminum cans with a thickness of 00111 inches Well com... View full answer

Get step-by-step solutions from verified subject matter experts


