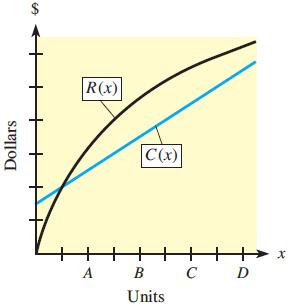
The figure shows the graph of a quadratic revenue function and a linear cost function. (a) At
Question:
The figure shows the graph of a quadratic revenue function and a linear cost function.
(a) At which of the four x-values shown is the distance between the revenue and the cost greatest?
(b) At which of the four x-values shown is the profit largest?
(c) At which of the four x-values shown is the slope of the tangent to the revenue curve equal to the slope of the cost line?
(d) What is the relationship between marginal cost and marginal revenue when profit is at its maximum value?

Fantastic news! We've Found the answer you've been seeking!
Step by Step Answer:
Related Book For 

Mathematical Applications For The Management, Life And Social Sciences
ISBN: 9781337625340
12th Edition
Authors: Ronald J. Harshbarger, James J. Reynolds
Question Posted:


