When finding critical values, we often need significance levels other than those available in Table A-3. Some
Question:
When finding critical values, we often need significance levels other than those available in Table A-3. Some computer programs approximate critical t values by calculating ![]()
where df = n - 1, e = 2.718, A = z(8 • df + 3)/(8 • df + 1), and z is the critical z score. Use this approximation to find the critical t score for Exercise 12 “Tornadoes,” using a significance level of 0.05. Compare the results to the critical t score of 1.648 found from technology. Does this approximation appear to work reasonably well?
Data From Exercise 22:
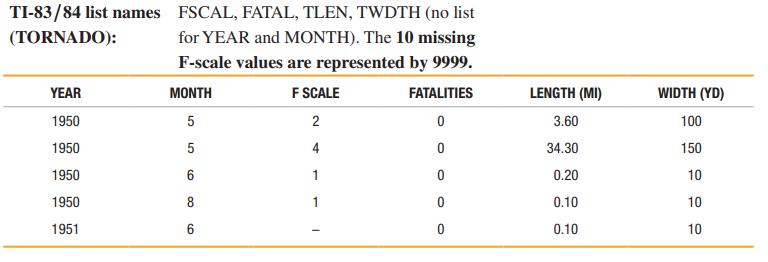
Data Set 22 “Tornadoes” in Appendix B includes data from 500 random tornadoes. The accompanying StatCrunch display results from using the tornado lengths (miles) to test the claim that the mean tornado length is greater than 2.5 miles.
 Data Set 22: Tornadoes
Data are from 500 tornadoes (first five rows shown here) arranged chronologically. MONTH is the month of the tornado (1 = January), F SCALE is the Fujita scale rating of tornado intensity, FATALITIES is number of deaths caused by the tornado, LENGTH (MI) is the distance the tornado traveled in miles, and WIDTH (YD) is the tornado width in yards. Data are from the National Weather Service.

Step by Step Answer:

Mathematical Interest Theory
ISBN: 9781470465681
3rd Edition
Authors: Leslie Jane, James Daniel, Federer Vaaler


