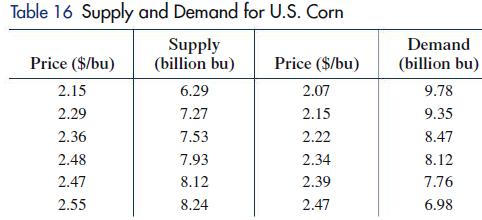
Table 16 contains pricesupply data and pricedemand data for corn. Find a linear regression model for the
Question:
Table 16 contains price–supply data and price–demand data for corn. Find a linear regression model for the price–supply data where x is supply (in billions of bushels) and y is price (in dollars). Do the same for the price–demand data. (Round regression coefficients to two decimal places.) Find the equilibrium price for corn.

Fantastic news! We've Found the answer you've been seeking!
Step by Step Answer:
Related Book For 

Finite Mathematics For Business Economics Life Sciences And Social Sciences
ISBN: 9780134862620
14th Edition
Authors: Raymond Barnett, Michael Ziegler, Karl Byleen, Christopher Stocker
Question Posted:


