All Matches
Solution Library
Expert Answer
Textbooks
Search Textbook questions, tutors and Books
Oops, something went wrong!
Change your search query and then try again
Toggle navigation
FREE Trial
S
Books
FREE
Tutors
Study Help
Expert Questions
Accounting
General Management
Mathematics
Finance
Organizational Behaviour
Law
Physics
Operating System
Management Leadership
Sociology
Programming
Marketing
Database
Computer Network
Economics
Textbooks Solutions
Accounting
Managerial Accounting
Management Leadership
Cost Accounting
Statistics
Business Law
Corporate Finance
Finance
Economics
Auditing
Hire a Tutor
AI Study Help
New
Search
Search
Sign In
Register
study help
mathematics
essentials business statistics
Questions and Answers of
Essentials Business Statistics
The accompanying file contains five years of monthly data for the time series y. Create the time variable and the monthly dummy variables to estimate an exponential trend model with seasonal dummy
The accompanying file contains five years of monthly data for the time series y. Create the time variable and the monthly dummy variables to estimate a linear trend model with seasonal dummy
The accompanying file contains ten years of quarterly data for the time series y along with the time variable, t, and dummy variables for each quarter, di. Estimate an exponential trend model with
The accompanying table shows a portion of the average price of gas (in $ per gallon) for the 50 states in the United States.State
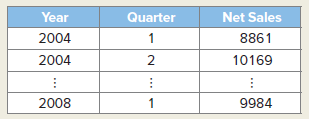
The following data represent a portion of quarterly net sales (in $ millions) of Lowe?s Companies, Inc., over five years. Estimate an exponential trend model with quarterly dummy variables to
An analyst studies quarterly data on the relationship between retail sales (y, in $ millions), gross national product (x, in $ billions), and a quarterly dummy d that equals 1 if the sales are for
Housing starts are the number of new residential construction projects that have begun during any given month. It is considered to be a leading indicator of economic strength. The following table
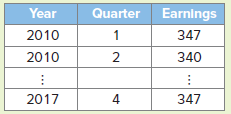
Data on weekly earnings are collected as part of the Current Population Survey, a nationwide sample survey of households in which respondents are asked how much each wage and salary worker usually
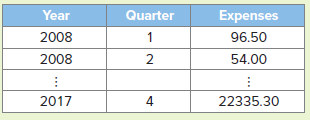
The controller of a small construction company is attempting to forecast expenses for the next year. He collects quarterly data on expenses (in $1,000s) over the past five years, a portion of which
The accompanying file contains ten years of quarterly data for the time series y along with the time variable, t, and dummy variables for each quarter, di. Estimate a linear trend model with seasonal
Consider an exponential trend model with seasonal dummy variables where t represents time and di represents the ith quarter. Using five years of quarterly data, the model is estimated as Make a
The accompanying data file contains 20 observations for t and yt.a. Plot the series along with the superimposed linear and exponential trends. Which trend model do you think describes the data
Consider the estimated quadratic modelŷ = 20 − 0.72x + 0.02x2.a. Predict y when x equals 10, 20, and 30.b. Find the value of x at which the predicted y is optimized. At this x value, is the
Consider the estimated quadratic modelŷ = 20 + 1.9x − 0.05x2.a. Predict y when x equals 10, 20, and 30.b. Find the value of x at which the predicted y is optimized. At this x value, is the
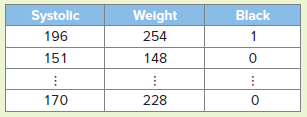
Important risk factors for high blood pressure reported by the National Institute of Health include weight and ethnicity. High blood pressure is common in adults who are overweight and are
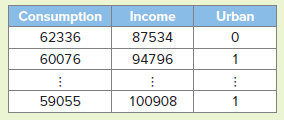
A sociologist is looking at the relationship between consumption expenditures of families in the United States (Consumption in $), family income (Income in $), and whether or not the family lives in
The accompanying data file contains 20 observations on the response variable y along with the explanatory variables x and d.a. Estimate and interpret a regression model with the explanatory variables
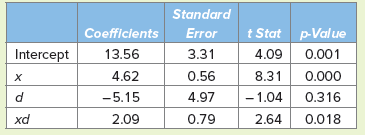
Using 20 observations, the following regression output is obtained from estimating y = ?0 + ?1x + ?2d + ?3xd + ?. a. Compute y? for x = 10 and d = 1; compute y? for x = 10 and d = 0. b. Are the
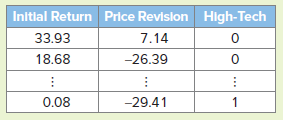
One of the theories regarding initial public offering (IPO) pricing is that the initial return y (the percentage change from offer to open price) on an IPO depends on the price revision x (the
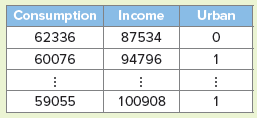
A sociologist is studying the relationship between consumption expenditures of families in the United States (Consumption in $), family income (Income in $), and whether or not the family lives in an
A simple linear regression, y = ?0 + ?1x + ?, is estimated with cross-sectional data. The resulting residuals e along with the values of the explanatory variable x are shown in the accompanying
In a simple linear regression, the following sample regression coefficients were estimated: b0 = −1.5 and b1 = 3.4.a. Formulate the sample regression equation.b. Predict y if x equals 5.
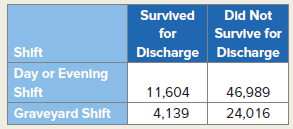
A study in the Journal of the American Medical Association (February 20, 2008) found that patients who go into cardiac arrest while in the hospital are more likely to die if it happens after 11 pm.
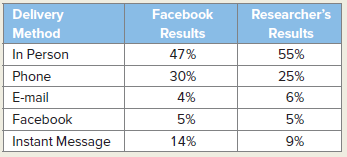
Although founded only in 2004, Facebook has nearly 2 billion active users, of which 50% log on to Facebook on any given day. In a survey by Facebook, young users were asked about theirpreference for
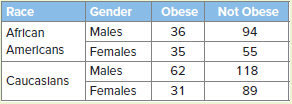
According to a report by the Centers for Disease Control and Prevention (CDC), 36.5% of American adults are obese (Adult Obesity Facts, August 29, 2017). Among ethnic groups in general, African
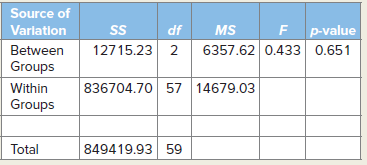
The marketing department for an upscale retail catalog company wants to determine if there are differences in the mean customer purchase amounts across the available purchase sources (Internet,
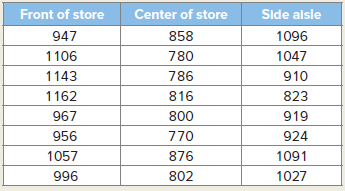
The Marketing Manager at Foodco, a large grocery store, wants to determine if store display location influences sales of a particular grocery item. He instructs employees to rotate the display
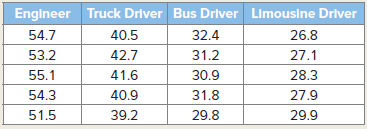
A government agency wants to determine whether the average salaries of four kinds of transportation operators differ. The accompanying table shows the salaries (in $1,000s) for a random sample of
The Great Recession cost America trillions of dollars in lost wealth and also levied a heavy toll on the national psyche (The Wall Street Journal, December 21, 2009). According to a poll, just 33% of
With increasing out-of-pocket healthcare costs, it is claimed that more than 60% of senior citizens are likely to make serious adjustments to their lifestyle. Test this claim at the 1% level of
Given the accompanying sample data, use Excel’s formula options to determine if the population mean differs from 1 at the 5% significance level. Assume that the population is normally distributed.
Given the accompanying sample data, use Excel’s formula options to determine if the population mean is greater than 116 at the 5% significance level. Assume that the population is normally
Consider the following hypotheses: H0: ? ? 100 HA: ? The population is normally distributed. A sample produces the following observations: Conduct the test at the 1% level of significance. 85 97
Given the accompanying sample data, use Excel’s formula options to determine if the population mean differs from 3 at the 5% significance level. Assume that the population is normally distributed
Given the accompanying sample data, use Excel’s formula options to determine if the population mean is less than 125 at the 5% significance level. Assume that the population is normally distributed
Given the accompanying sample data, use Excel’s formula options to find the 99% confidence interval for the population mean. Assume that the population is normally distributed.
Given the accompanying sample data, use Excel’s formula options to find the 90% confidence interval for the population mean. Assume that the population is normally distributed.
Given the accompanying sample data, use Excel’s formula options to find the 90% confidence interval for the population mean. Assume that the population is normally distributed and that the
Given the accompanying sample data, use Excel’s formula options to find the 95% confidence interval for the population mean. Assume that the population is normally distributed and that the
On St. Patrick’s Day, men spend an average of $43.87 while women spend an average of $29.54 (USA TODAY, March 17, 2009). Assume the standard deviations of spending for men and women are $2.50 and
High blood pressure is common in adults who are overweight and are black American. According to the American Heart Association, 47% of black men and 43% of black women have high blood pressure.
Let P(A) = 0.55, P(B) = 0.30, and P(A ∩ B) = 0.10.a. Calculate P(A | B).b. Calculate P(A ∪ B).c. Calculate P((A ∪ B)c).
Let P(A) = 0.65, P(B) = 0.30, and P(A | B) = 0.45.a. Calculate P(A ∩ B).b. Calculate P(A ∪ B).c. Calculate P(B | A).
A sample space S yields three mutually exclusive and exhaustive events, A, B, and C, such that P(A) = 0.25 and P(A ∪ B) = 0.70.a. Find P(C).b. Find P(BC).c. Find P(A ∩ C).
In an attempt to determine whether a linear relationship exists between the price of a home (x in $1,000s) and the number of days it takes to sell the home (y), a real estate agent collected the
Given the accompanying data, use Excel’s function options to find the sample covariance and the sample correlation coefficient.
Consider the following sample data: a. Calculate the covariance. b. Calculate and interpret the correlation coefficient. 25 12 18 20 х 15 25 22 27
Consider the following sample data: a. Calculate the covariance. b. Calculate and interpret the correlation coefficient. 4 х -2 -2 -3 -8 -9 - 10 y
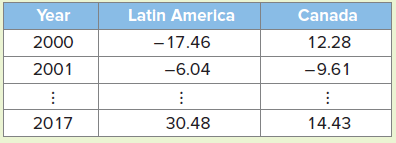
The accompanying table shows a portion of the annual returns (in %) for the Fidelity Latin America Fund and the Fidelity Canada Fund from 2000 through 2017. a. Which fund had the higher average
Consider the following summary measures for the annual returns for Vanguard’s Energy Fund and Vanguard’s Health Care Fund from 2005 through 2017.Energy: x̅ = 9.62% and s = 23.58%Health Care: x̅
Given the accompanying data, use Excel’s function options to find MAD, the sample variance, and the sample standard deviation.
Consider the following sample data: a. Calculate the range. b. Calculate MAD. c. Calculate the sample variance. d. Calculate the sample standard deviation. 52 40 48 32 38 42
Consider the following population data: a. Calculate the range. b. Calculate MAD. c. Calculate the population variance. d. Calculate the population standard deviation. -4 -8 10
Consider the following population data: a. Calculate the range. b. Calculate MAD. c. Calculate the population variance. d. Calculate the population standard deviation. 10 42 34 12 22
The following five-point summary and boxplot represent the salaries (in $) of 100 employees at a large firm. a. Interpret Q1 and Q3. b. Do outliers exist in the data? Explain. c. Is the
In order to get an idea on current buying trends, a real estate agent collects data on 10 recent house sales in the area. Specifically, she notes the number of bedrooms in each house as follows: a.
At a small firm in Boston, seven employees were asked to report their one-way commute time (in minutes) into the city. Their responses were as follows. a. How long was the shortest commute? The
Given the accompanying data, use Excel’s function options to find the mean and the median.
Construct a scatterplot with the following data. Does a linear relationship exist between x and y? 3 10 4 6. х 4
Consider the following data set: Construct a stem-and-leaf diagram. Is the distribution symmetric? Explain. -64 -52 -73 -82 -85 –80 -79 -65 - 50 -71 -80 -85 -75 -65 -77-87 -72 -83 -73 -80
Consider the following data set: Construct a stem-and-leaf diagram. Is the distribution symmetric? Explain. 5.4 4.6 3.5 2.8 2.6 5.5 5.5 2.3 3.2 4.2 4.0 3.0 3.6 4.5 4.7 4.2 3.3 3.2 4.2 3.4
Many people regard video games as an obsession for youngsters, but, in fact, the average age of a video game player is 35 years (Telegraph.co.uk, July 4, 2013). Is the value 35 likely the actual or