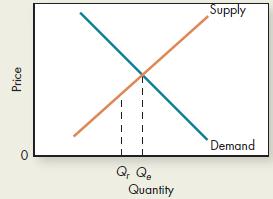
6. Demonstrate graphically the net gain to producers and the net loss to consumers if suppliers are...
Question:
6. Demonstrate graphically the net gain to producers and the net loss to consumers if suppliers are able to restrict their output to Q r in the accompanying graph Demonstrate the net deadweight loss to society.

Fantastic news! We've Found the answer you've been seeking!
Step by Step Answer:
Related Book For 

Question Posted:


