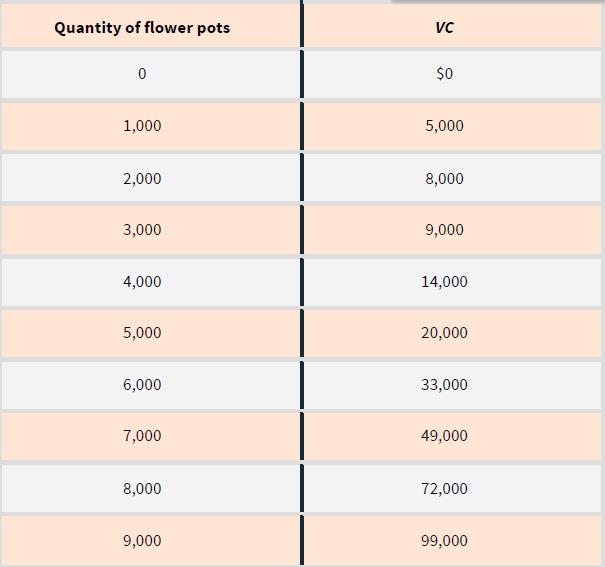
Consider again Bobs company described in Problem 3. a. Draw Bobs marginal cost curve. b. Over what
Question:
Consider again Bob’s company described in Problem 3.
a. Draw Bob’s marginal cost curve.
b. Over what range of prices will Bob produce no flower pots in the short run?
c. Draw Bob’s individual supply curve. In your graph, plot the price range from $0 to $60 in increments of $10.
Data From Problem 3:
Bob produces flower pots for sale, which he designs and manufactures using 3-D printing technology. Bob rents a building for $30,000 per month and rents machinery for
$20,000 a month. Those are his fixed costs. His variable cost per month is given in the accompanying table.


Step by Step Answer:
Related Book For 

Question Posted:


