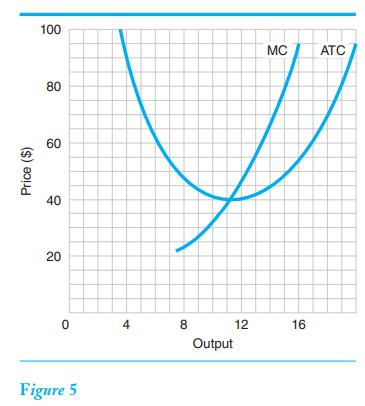
In Figure 5 draw in the demand curve and the marginal revenue curve of a monopolist taking
Question:
In Figure 5 draw in the demand curve and the marginal revenue curve of a monopolist taking a loss. At what output does the firm produce?

Transcribed Image Text:
Price ($) 100 80 60 40 20 0 Figure 5 4 8 Output 12 MC 16 ATC
Step by Step Answer:

This question has not been answered yet.
You can Ask your question!
Related Book For 

Question Posted:
Students also viewed these Business questions
-
Suppose that the demand curve for a product x provided by a monopolist is given by p = 90x and suppose further that the monopolists marginal cost curve is given by MC = x. A: In this part, we will...
-
Indicate whether each of the following items would be classified as (1) an operating activity, an investing activity, or a financing activity or (2) as a noncash transaction or noncash item. (a) Cash...
-
9. Under perfectly competitive conditions, marginal revenue is a. greater than average revenue b. equal to average revenue c. less than average revenue d. equal to the average variable Q10. A firm's...
-
What is the relationship between group norms and group cohesiveness? What roles do both cohesiveness and norms plan in shaping group performance?
-
Supply the missing dollar amounts for Lewis Retailers's income statement for each of the following independent cases: Beginning Inventory $100 Cost of Goods Cost of Cost of Ending Inventory Sales...
-
Andalus Furniture Company has two manufacturing plants, one at Aynor and another at Spartanburg. The cost in dollars of producing a kitchen chair at each of the two plants is given here. Aynor: Cost...
-
Manuel is planning to launch a new gourmet taco truck and is trying to decide where he should park his truck and what features and prices would entice consumers. He sends a request for proposal to...
-
On December 31, 2016, Jons Company had 1,300,000 shares of $5 par common stock issued and outstanding. At December 31, 2016, stockholders' equity had the amounts listed here. Common Stock...
-
Sperazza Corporation produces large commercial doors for warehouses and other facilities. In the most recent month, the company budgeted production of 5,500 doors. Actual production was 5,900 doors....
-
Using the information in Figure 6, calculate the total profit or total loss made by this firm. Price ($) 20 16 12 8 4 0 Figure 6 4 8 Output 12 MC ATC 16 D MR
-
In Figure 4 draw in the demand curve and the marginal revenue curve of a monopolist making a profit. How much is the most profitable output? Price ($) 50 40 30 20 10 0 Figure 4 10 20 30 Output MC ATC...
-
In JavaScript, what exactly does a constructor do?
-
who do you think sets the underlying ethical standards when the law is fuzzy on an issue? as business and societal issues develop in the future, how does your opinion in this area inform your...
-
how do i introduce low risk high reward for a new medical assistant supervisor role in an organization?
-
How do individual differences in cognitive styles, such as analytical versus intuitive thinking, impact problem-solving approaches and decision-making processes within teams ?
-
In Russian government, do you think that Russian Military Performance is good in warfare against Ukraine? Explain.
-
Why do you think the competing values framework is important to an organization's effectiveness? Describe the four profiles of the competing values framework. Identify one of the profiles and provide...
-
The age of an account receivable is the length of time that it has been outstanding. At the end of October, a firm has $12,570 in receivables that are 30 days old, $6850 in receivables that are 60...
-
Transform the while loop from the previous exercise into an equivalent for loop (make sure it produces the same output).
-
1. The income elasticity of demand is _____ (positive/negative) for normal goods and _____ (positive/negative) for inferior goods. 2. If a 20 percent increase in income increases the quantity of...
-
1. The income elasticity of demand is _____ (positive/negative) for normal goods and _____ (positive/negative) for inferior goods. 2. If a 20 percent increase in income increases the quantity of...
-
1. The income elasticity of demand is _____ (positive/negative) for normal goods and _____ (positive/negative) for inferior goods. 2. If a 20 percent increase in income increases the quantity of...
-
Indicate whether the following managerial policy increases the risk of a death spiral:Use of low operating leverage for productionGroup of answer choicesTrueFalse
-
It is typically inappropriate to include the costs of excess capacity in product prices; instead, it should be written off directly to an expense account.Group of answer choicesTrueFalse
-
Firms can avoid the death spiral by excluding excess capacity from their activity bases. Group of answer choicesTrueFalse

Study smarter with the SolutionInn App


