

Question: AP9.8 A control system is shown in Figure AP9.8. The gain K is greater than 500 and less than 4000. Select a gain that will
AP9.8 A control system is shown in Figure AP9.8. The gain K is greater than 500 and less than 4000. Select a gain that will cause the system step response to have a percent overshoot of P O. . ≤ 20%. Plot the Nichols chart and calculate the phase margin. 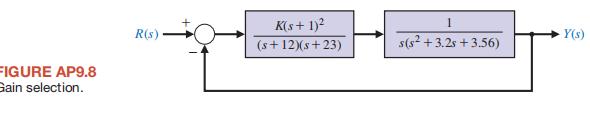
FIGURE AP9.8 Gain selection. R(s) K(s+ 1) (s+12)(s+23) 1 s(s +3.25 +3.56) Y(s)
Step by Step Solution
There are 3 Steps involved in it
1 Expert Approved Answer
Step: 1 Unlock

Question Has Been Solved by an Expert!
Get step-by-step solutions from verified subject matter experts
Step: 2 Unlock
Step: 3 Unlock