

Question: E8.9 The Bode plot of a system is shown in Figure E8.9. Estimate the transfer function G s ( ). FIGURE E8.9 Bode plot. Magnitude
E8.9 The Bode plot of a system is shown in Figure E8.9.
Estimate the transfer function G s( ).
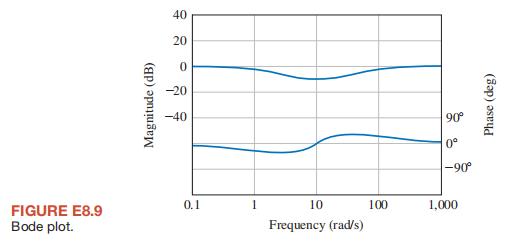
FIGURE E8.9 Bode plot. Magnitude (dB) 20 0 990 40 -20 -40 0.1 1 10 Frequency (rad/s) 90 0 -90 100 1,000 Phase (deg)
Step by Step Solution
There are 3 Steps involved in it
1 Expert Approved Answer
Step: 1 Unlock

Question Has Been Solved by an Expert!
Get step-by-step solutions from verified subject matter experts
Step: 2 Unlock
Step: 3 Unlock