

Question: E9.14 A Nichols chart is given in Figure E9.14 for a sys tem with G j c ( ) G j ( ).
E9.14 A Nichols chart is given in Figure E9.14 for a sys
tem with G j c( ) ω ω G j ( ). Using the following table, find
(a) the peak resonance Mpω in dB;
(b) the resonant frequency ωr;
(c) the 3-dB bandwidth; and
(d) the phase margin of the system.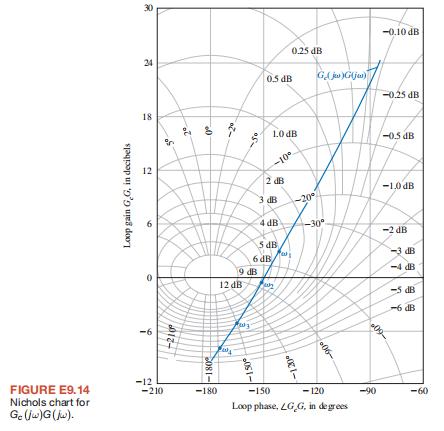
![]()
Loop gain G,G, in decibels -6 30 24 18 12 9 +210 5 081- == 0.5 dB 0.25 dB ()G ()G -0.10 dB -0.25 dB 1.0 dB -0.5 dB -10 2 dB 3 dB -1.0 dB -20 4 dB -30 -2 dB 5 dB -3 dB 6 dB 9 dB 12 dB -4 dB -5 dB -6 dB -150 +1- -900 09- -12 FIGURE E9.14 -210 -180 -150 -120 -90 -60 Nichols chart for Loop phase, LGG, in degrees Gc (jw)G(jw).
Step by Step Solution
There are 3 Steps involved in it

Get step-by-step solutions from verified subject matter experts