

Question: P8.6 The asymptotic log-magnitude curves for two loop transfer functions are given in Figure P8.6. Sketch the corresponding asymptotic phase shift curves for each system.
P8.6 The asymptotic log-magnitude curves for two loop transfer functions are given in Figure P8.6. Sketch the corresponding asymptotic phase shift curves for each system. Estimate the transfer function for each sys
tem. Assume that the systems have minimum phase transfer functions.
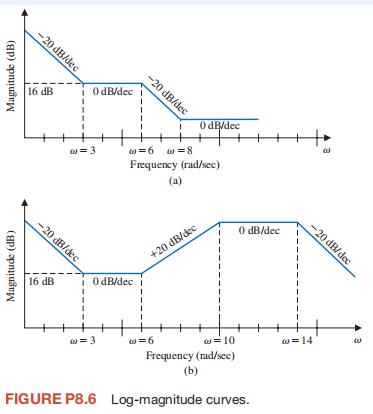
Magnitude (dB) -20 dB/dec 16 dB Magnitude (dB) 0 dB/dec i -20 dB/dec 0 dB/dec w=3 w=6w=8 Frequency (rad/sec) (a) -20 dB/dec 16 dB 0 dB/dec i +20 dB/dec w=3 60-6 0 dB/dec w -20 dB/dec =10 00-14 Frequency (rad/sec) (b) FIGURE P8.6 Log-magnitude curves. 3
Step by Step Solution
There are 3 Steps involved in it
1 Expert Approved Answer
Step: 1 Unlock

Question Has Been Solved by an Expert!
Get step-by-step solutions from verified subject matter experts
Step: 2 Unlock
Step: 3 Unlock