

Question: P9.22 The Nichols chart for G j c ( ) G j ( ) of a closed-loop system is shown in Figure P9.22.
P9.22 The Nichols chart for G j c( ) ω ω G j ( ) of a closed-loop system is shown in Figure P9.22. The frequency for each point on the graph is given in the following table:
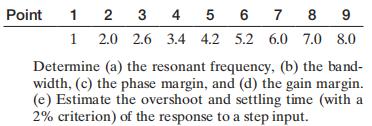
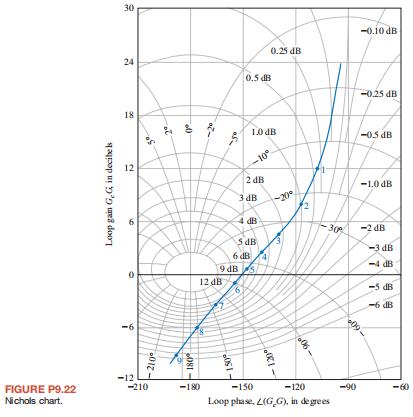
Point 1 2 3 4 5 6 7 8 9 1 2.0 2.6 3.4 4.2 5.2 6.0 7.0 8.0 Determine (a) the resonant frequency, (b) the band- width, (c) the phase margin, and (d) the gain margin. (e) Estimate the overshoot and settling time (with a 2% criterion) of the response to a step input.
Step by Step Solution
There are 3 Steps involved in it
1 Expert Approved Answer
Step: 1 Unlock

Question Has Been Solved by an Expert!
Get step-by-step solutions from verified subject matter experts
Step: 2 Unlock
Step: 3 Unlock